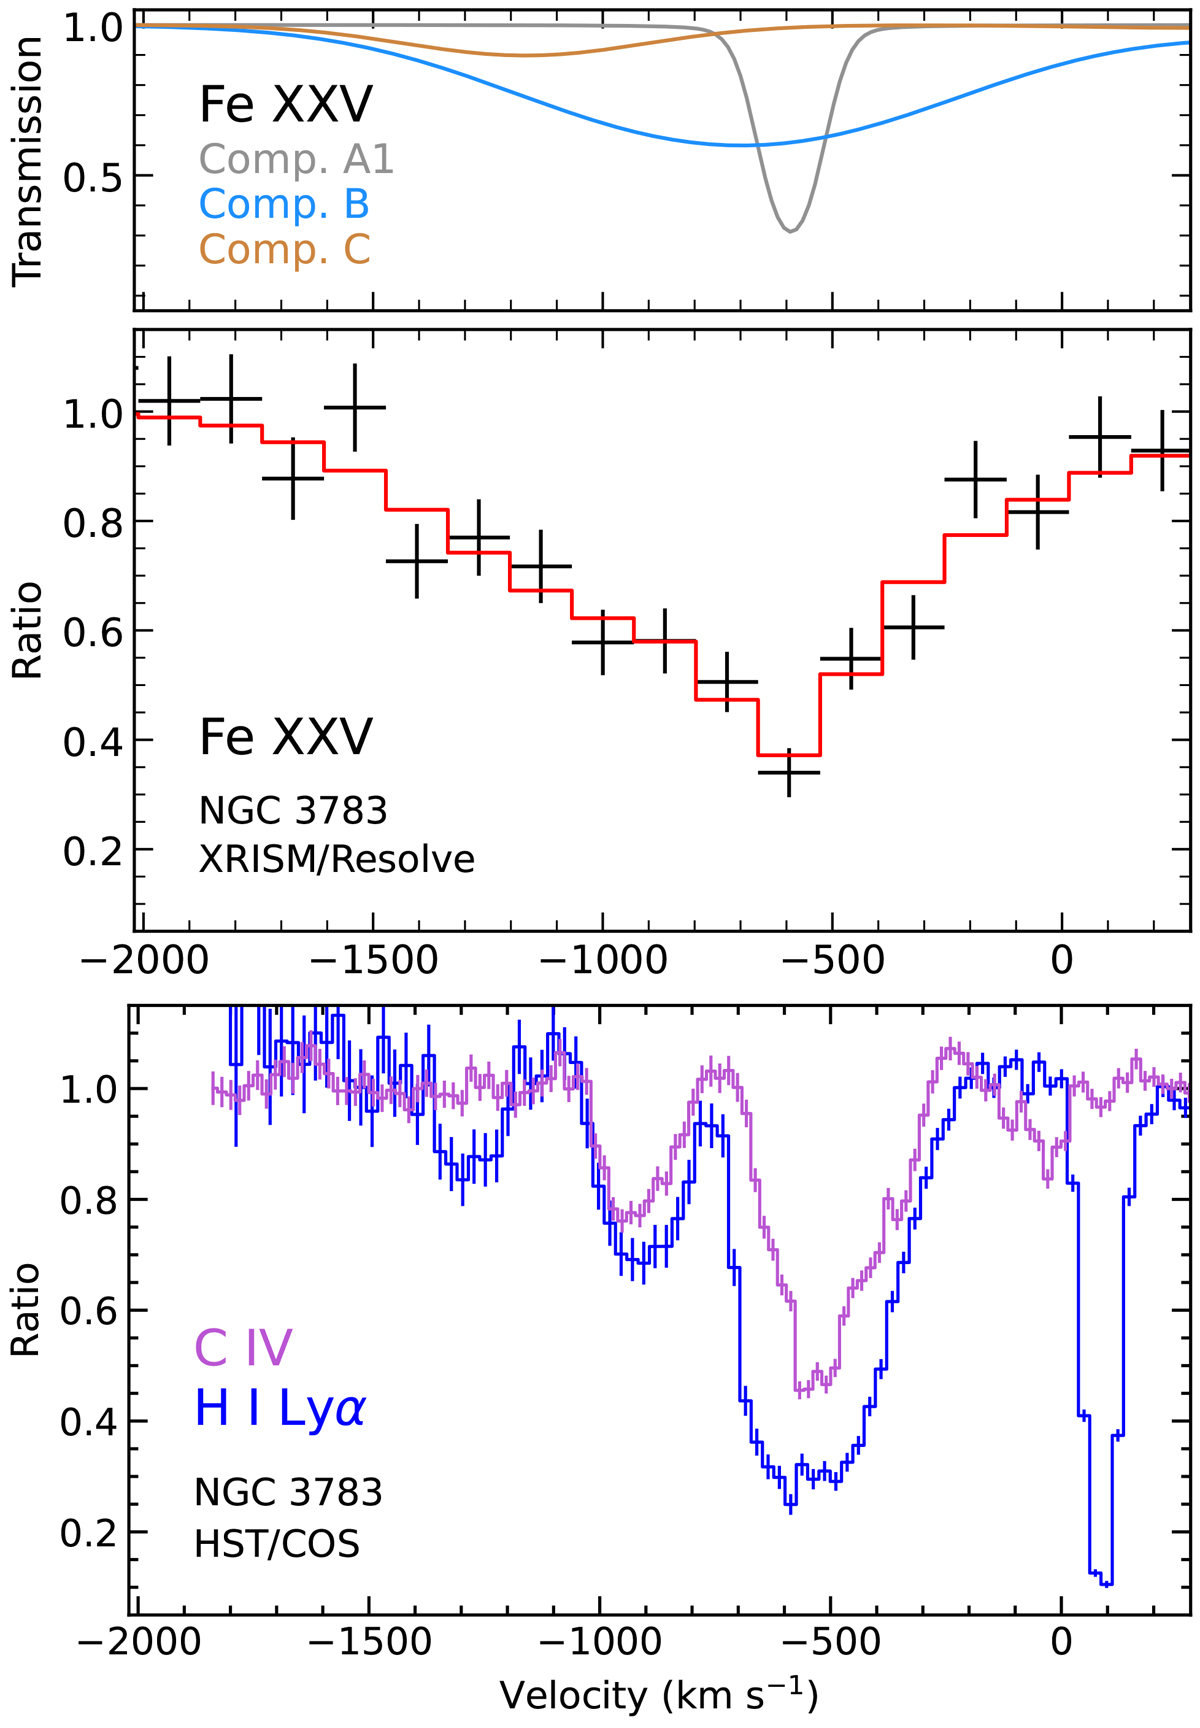
Fig. 4.
Download original image
Absorption profile of the Fe XXV resonance line in the XRISM Resolve spectrum compared to those of Lyα and C IV in the 2024 HST COS spectrum. The data are normalized to the continuum, showing the flux ratio on the y-axis. The red model in the middle panel corresponds to the best-fit model shown in Fig. 1, with its parameters given in Table 1. The top panel illustrates how the individual components of the model contribute to the Fe XXV absorption. In this figure negative velocity corresponds to an outflow, while positive corresponds to an inflow.
Current usage metrics show cumulative count of Article Views (full-text article views including HTML views, PDF and ePub downloads, according to the available data) and Abstracts Views on Vision4Press platform.
Data correspond to usage on the plateform after 2015. The current usage metrics is available 48-96 hours after online publication and is updated daily on week days.
Initial download of the metrics may take a while.