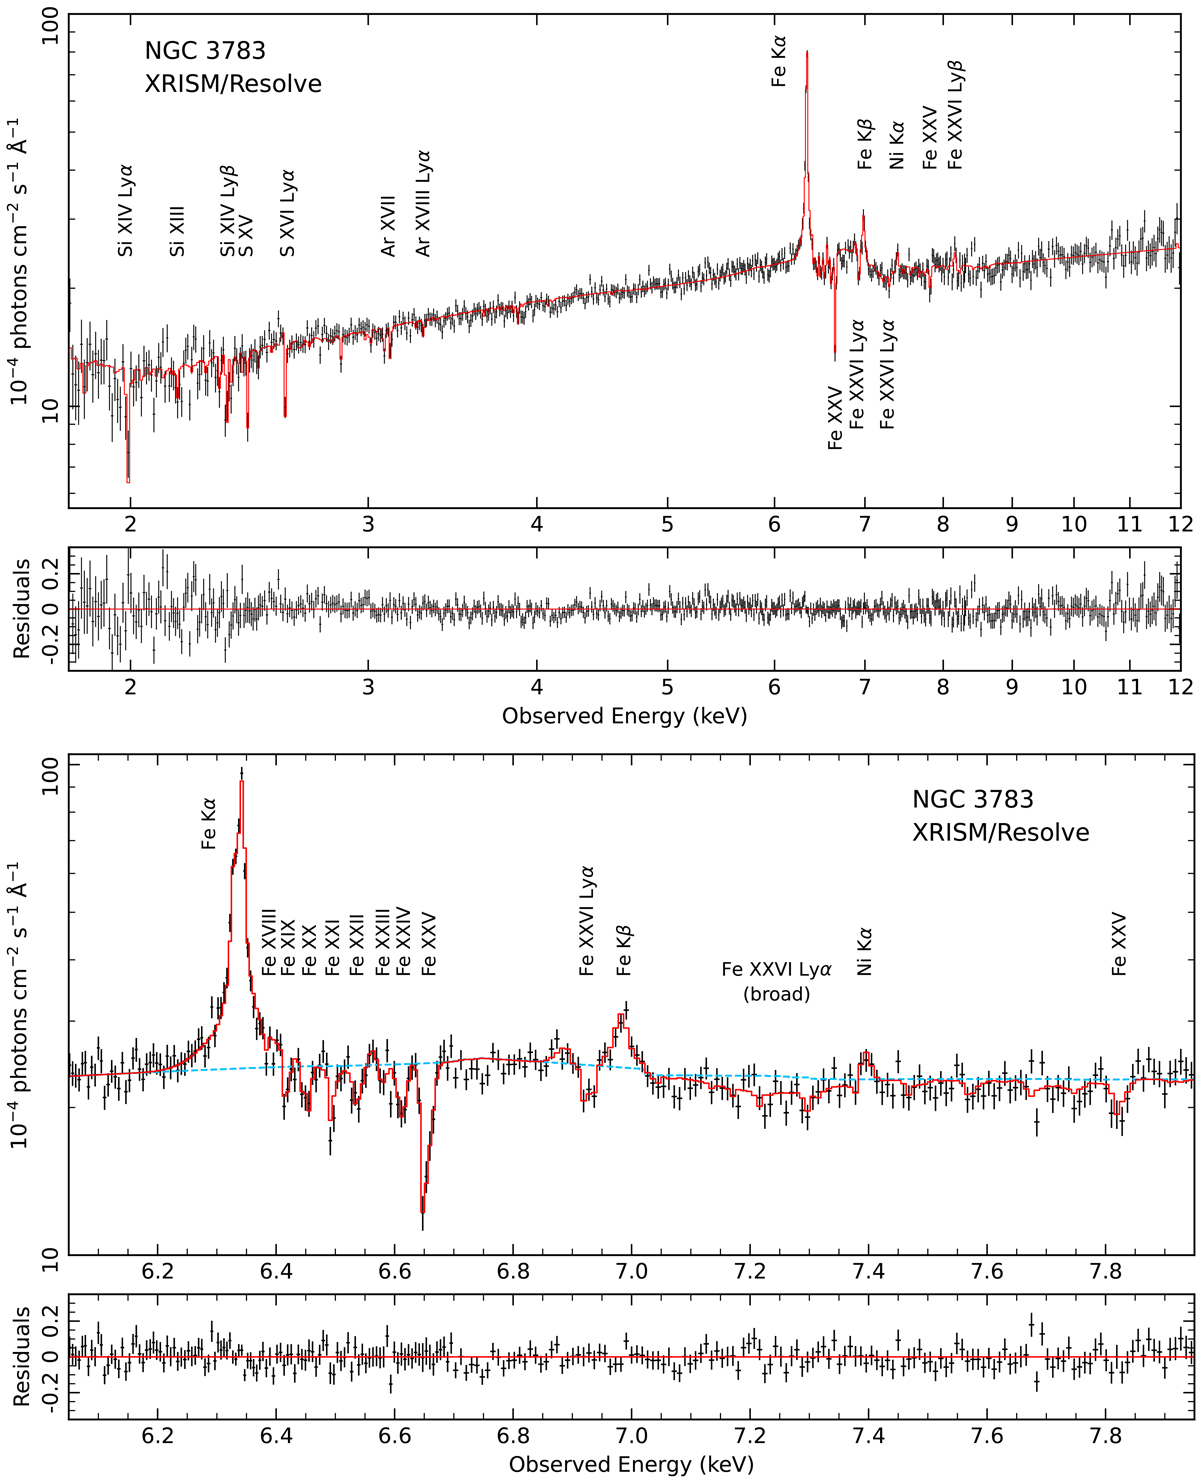
Fig. 1.
Download original image
XRISM/Resolve spectrum of NGC 3783 with our best-fit model. The top two panels show the full spectrum and the corresponding fit residuals. The bottom two panels provide a close-up view of the Fe K band and its fit residuals. For clarity of display, the spectrum is additionally binned up. The strongest emission and absorption features are labeled. Our best-fit model (Table 1) is shown in red. The fit residuals are defined as (data – model)/model. For comparison, the dashed blue line in the third panel represents the continuum plus the broad Fe K emission, excluding any absorption lines.
Current usage metrics show cumulative count of Article Views (full-text article views including HTML views, PDF and ePub downloads, according to the available data) and Abstracts Views on Vision4Press platform.
Data correspond to usage on the plateform after 2015. The current usage metrics is available 48-96 hours after online publication and is updated daily on week days.
Initial download of the metrics may take a while.