Fig. 9.
Download original image
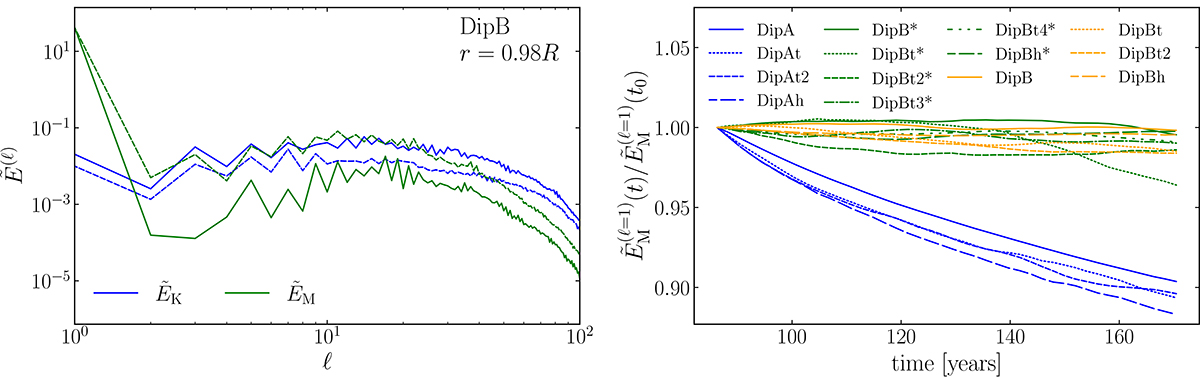
Left panel: Normalized power spectra of the velocity ![]() and magnetic fields
and magnetic fields ![]() from DipB at r = 0.98R. The solid lines show the power spectra from early times (first 15 years) of the simulation, and the dashed lines the late times (last 15 years). Right panel: Temporal evolution of the dipolar contribution (ℓ = 1) of the power spectra of the magnetic field
from DipB at r = 0.98R. The solid lines show the power spectra from early times (first 15 years) of the simulation, and the dashed lines the late times (last 15 years). Right panel: Temporal evolution of the dipolar contribution (ℓ = 1) of the power spectra of the magnetic field ![]() from all the simulations. The values were normalized by
from all the simulations. The values were normalized by ![]() at the starting point of each simulation (at t0 = 85 years), for a better comparison.
at the starting point of each simulation (at t0 = 85 years), for a better comparison.
Current usage metrics show cumulative count of Article Views (full-text article views including HTML views, PDF and ePub downloads, according to the available data) and Abstracts Views on Vision4Press platform.
Data correspond to usage on the plateform after 2015. The current usage metrics is available 48-96 hours after online publication and is updated daily on week days.
Initial download of the metrics may take a while.