Fig. 2.
Download original image
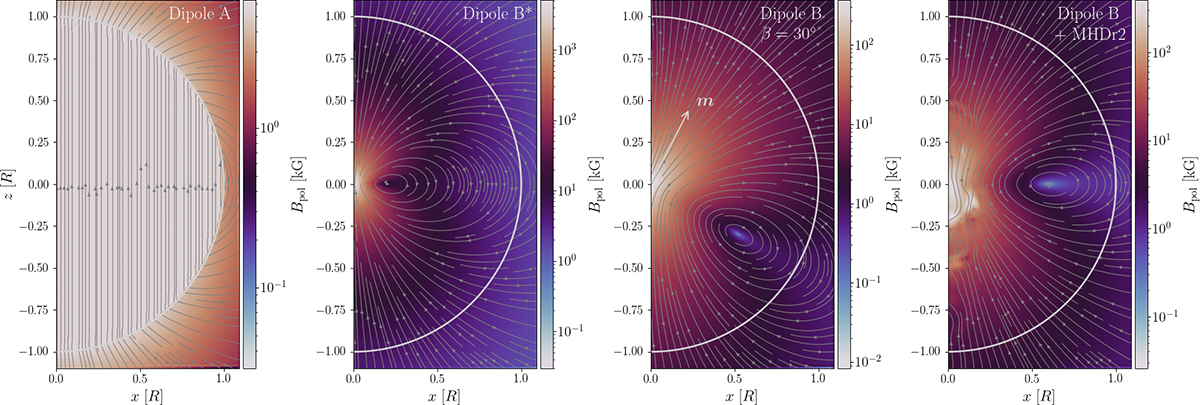
Imposed initial (fossil) magnetic fields in our simulations. The arrows represent the poloidal magnetic field lines, and the colormap the intensity of this component. Dipole A and Dipole B* are aligned to the rotational axis (β = 0°), and as an example of a misaligned dipole an inclination of β = 30° was added in Dipole B. The last panel corresponds to the initial snapshot of run DipB (Dipole B + MHDr2).
Current usage metrics show cumulative count of Article Views (full-text article views including HTML views, PDF and ePub downloads, according to the available data) and Abstracts Views on Vision4Press platform.
Data correspond to usage on the plateform after 2015. The current usage metrics is available 48-96 hours after online publication and is updated daily on week days.
Initial download of the metrics may take a while.