Fig. 7.
Download original image
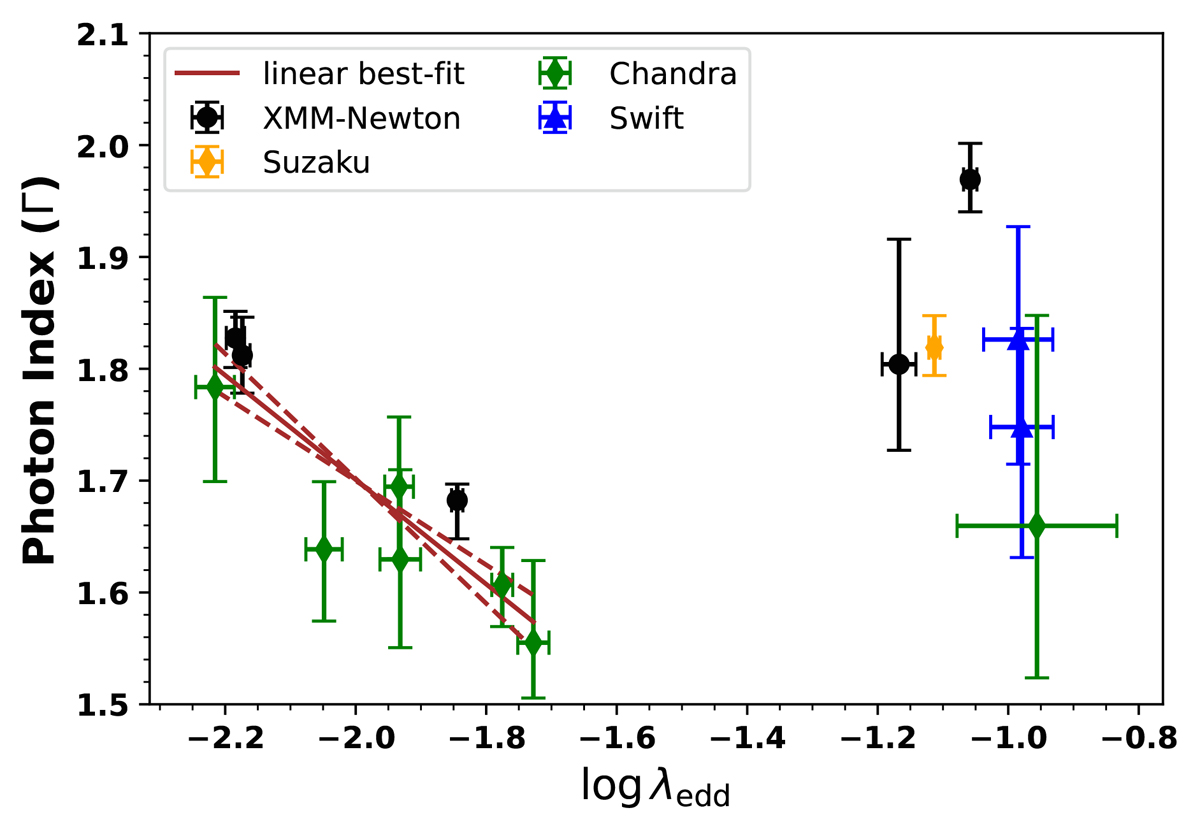
Evolution of the photon index (Γ) of the intrinsic hot corona power law with respect to the Eddington ratio (λedd=Lbol/Ledd). The different colors represent different missions: green, Chandra; red, Chandra observation from 2010 evaluated from readout streak; blue, XMM-Newton; orange, Suzaku; brown solid line, linear regression best-fit in the softer-when-fainter state; brown dashed line, the uncertainty range of the linear fit. The soft-when-fainter trend is evident for log λEdd<−1.7.
Current usage metrics show cumulative count of Article Views (full-text article views including HTML views, PDF and ePub downloads, according to the available data) and Abstracts Views on Vision4Press platform.
Data correspond to usage on the plateform after 2015. The current usage metrics is available 48-96 hours after online publication and is updated daily on week days.
Initial download of the metrics may take a while.