Fig. 4.
Download original image
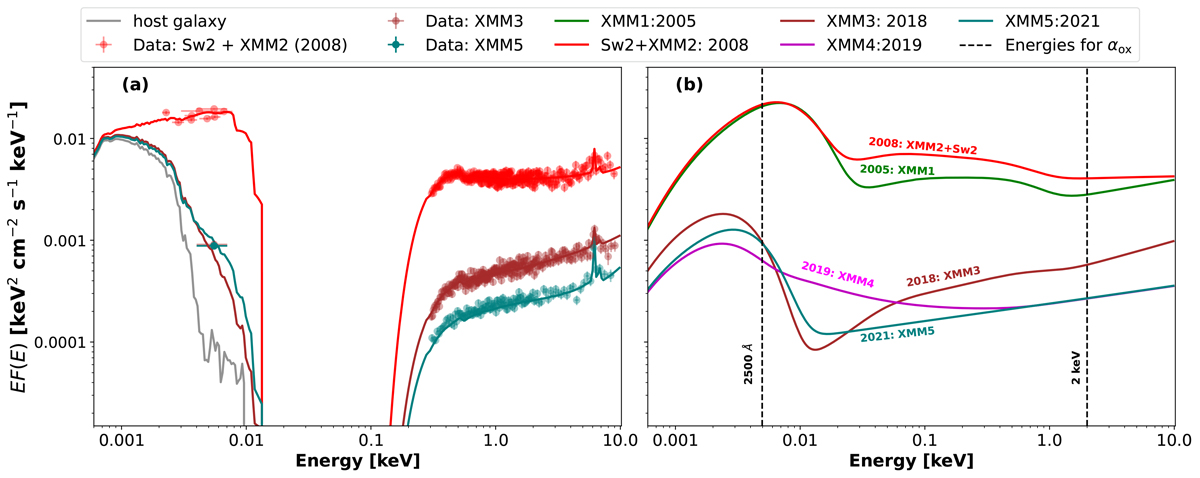
Broadband SED fits using the agnsed model. (a) Absorbed total broadband model. The circular markers indicate XMM-Newton EPIC-pn+OM datasets for the XMM3, and XMM5 observations and XMM-Newton EPIC-pn + OM + Swift-UVOT datasets for XMM2. The solid lines of corresponding color represents the best-fit total models. The XMM1 and XMM4 data points are not plotted for clarity. For XMM3 and XMM5 the OM photometric points almost overlap with each other since they have almost equal fluxes. (b) Corresponding unabsorbed agnsed models. They indicate the significant changes occurring in the intrinsic spectrum, within both the bright and faint flux states. The dashed lines indicate energies used to calculate the optical-X-ray spectral index αOX.
Current usage metrics show cumulative count of Article Views (full-text article views including HTML views, PDF and ePub downloads, according to the available data) and Abstracts Views on Vision4Press platform.
Data correspond to usage on the plateform after 2015. The current usage metrics is available 48-96 hours after online publication and is updated daily on week days.
Initial download of the metrics may take a while.