Fig. 2.
Download original image
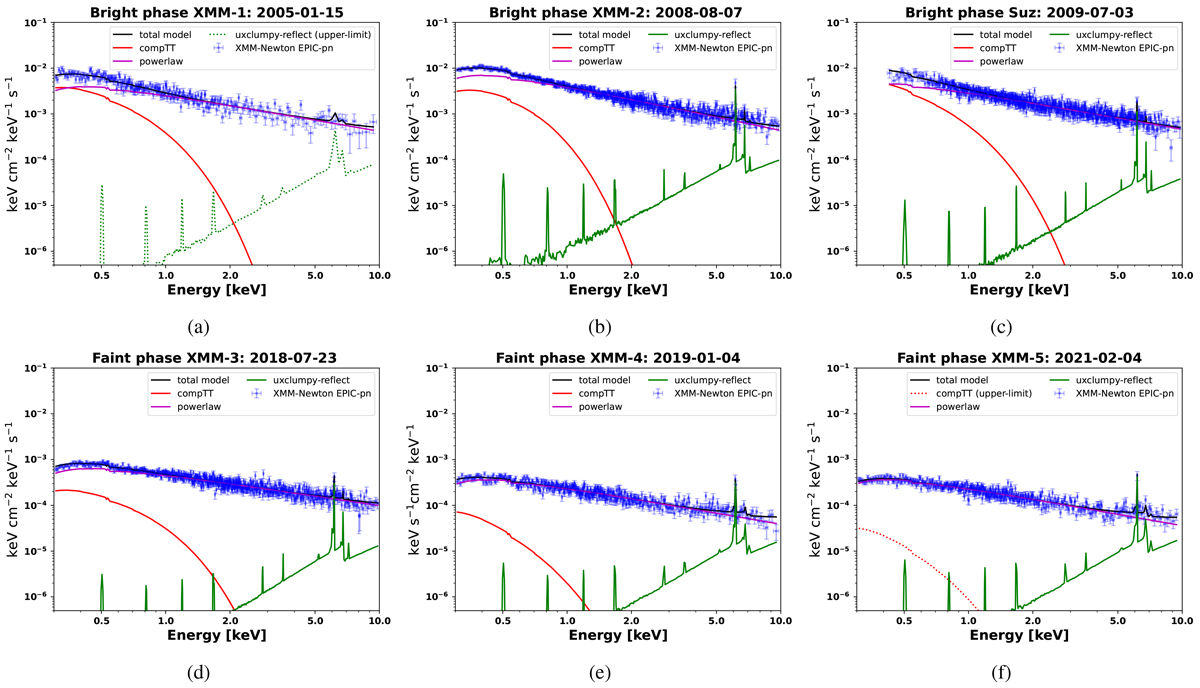
Unfolded best-fitting models for the XMM-Newton EPIC-pn pattern 0 and Suzaku XIS-0 data. The spectral model is the best-fitting, physically motivated model M3 (Sect. 3.1). Solid curves: model evaluated at best fit value; dotted curves: model evaluated at the upper limit; blue markers: unfolded data; red curve: soft X-ray excess modeled by compTT; magenta curve: hot-corona power law; green curve: uxclumpy torus reflection model; black curve: the total unfolded X-ray spectrum. Panels (a), (b), and (c) show bright-state spectra; panels (d), (e), and (f) are for the faint state. These plots illustrate how all X-ray spectral components drop significantly in flux. The strongest drop is for the soft excess, which ultimately disappears in 2021.
Current usage metrics show cumulative count of Article Views (full-text article views including HTML views, PDF and ePub downloads, according to the available data) and Abstracts Views on Vision4Press platform.
Data correspond to usage on the plateform after 2015. The current usage metrics is available 48-96 hours after online publication and is updated daily on week days.
Initial download of the metrics may take a while.