Fig. 9.
Download original image
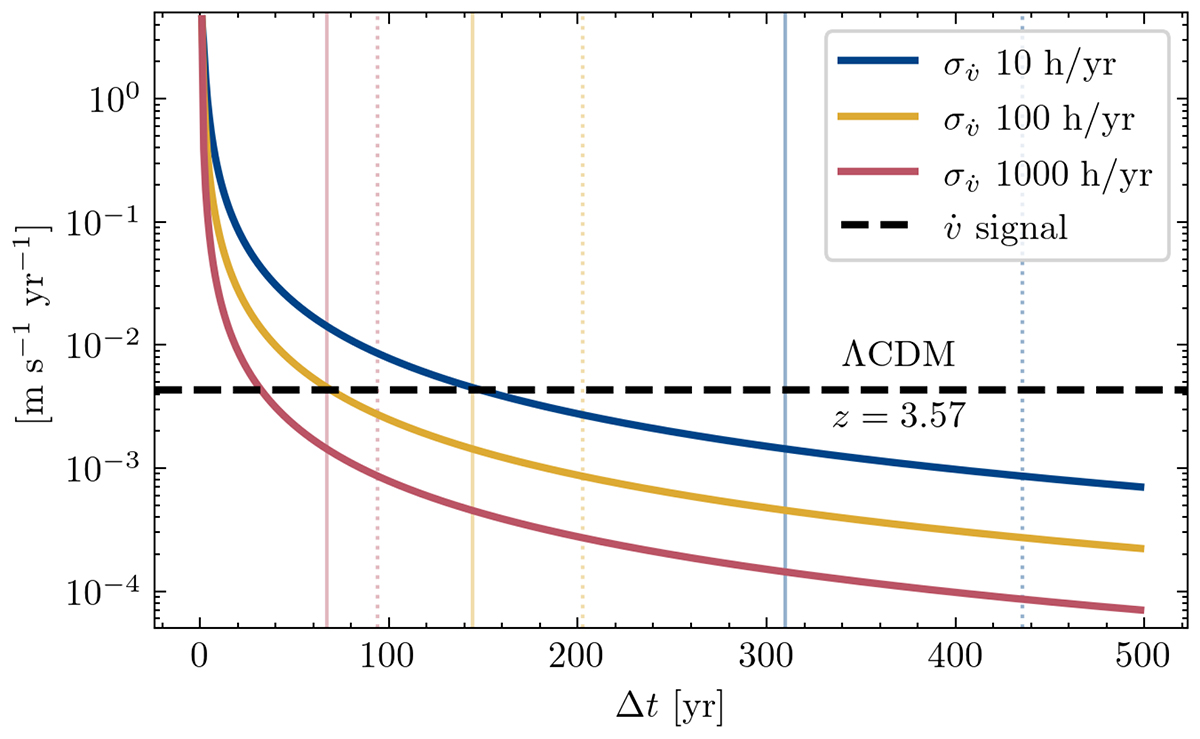
Velocity shift uncertainty reached with ESPRESSO spectra of SB2, as a function of total temporal baseline of the experiment, assuming three different observational strategies with an integration time of 10 hours per year (blue), 100 hours per year (yellow), and 1000 hours per year (red). The horizontal dashed black line defines the magnitude of the cosmological signal expected for a ΛCDM Universe at the average redshift of SB2's Lyman-α forest. Vertical lines define the time needed to achieve a 3σ (solid) and 5σ (dotted) detection for the three observational strategies.
Current usage metrics show cumulative count of Article Views (full-text article views including HTML views, PDF and ePub downloads, according to the available data) and Abstracts Views on Vision4Press platform.
Data correspond to usage on the plateform after 2015. The current usage metrics is available 48-96 hours after online publication and is updated daily on week days.
Initial download of the metrics may take a while.