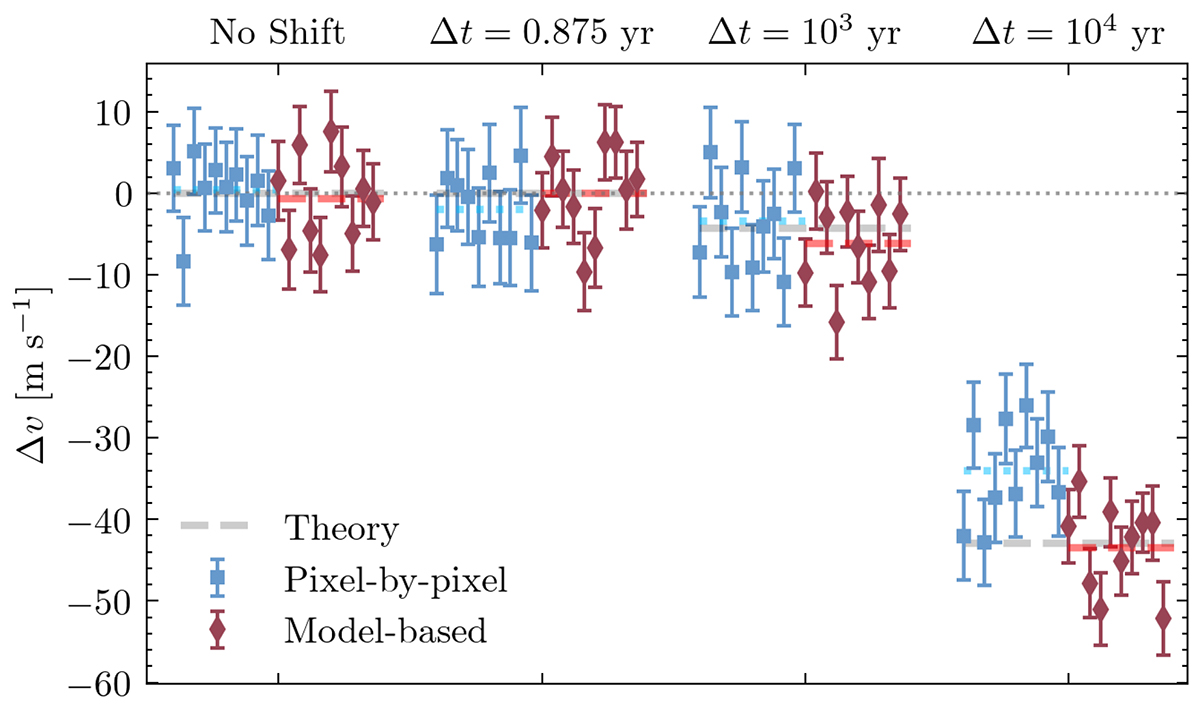
Fig. 7.
Download original image
Velocity shift, Δv, measured on ten random mock sightline pairs with both the pixel-by-pixel (blue square scatter points, see Sect. 5) and model-based methods (red diamond scatter points, see Sect. 6.4) where a different baseline is assumed between the two epochs. The horizontal blue dotted and dashed red lines report the average Δv measured with the pixel-by-pixel and the model-based methods, respectively. From left to right, the mock datasets are built assuming no shift (Δvexp = 0 m s−1), Δt = 0.875 yr (the same time elapsed between the two observed spectra, Δvexp=−0.38 cm s−1), Δt = 103 yr (Δvexp=−4.3 m s−1), and Δt = 104 yr (Δvexp=−42.9 m s−1). The dashed grey lines report the assumed shift.
Current usage metrics show cumulative count of Article Views (full-text article views including HTML views, PDF and ePub downloads, according to the available data) and Abstracts Views on Vision4Press platform.
Data correspond to usage on the plateform after 2015. The current usage metrics is available 48-96 hours after online publication and is updated daily on week days.
Initial download of the metrics may take a while.