Fig. 5.
Download original image
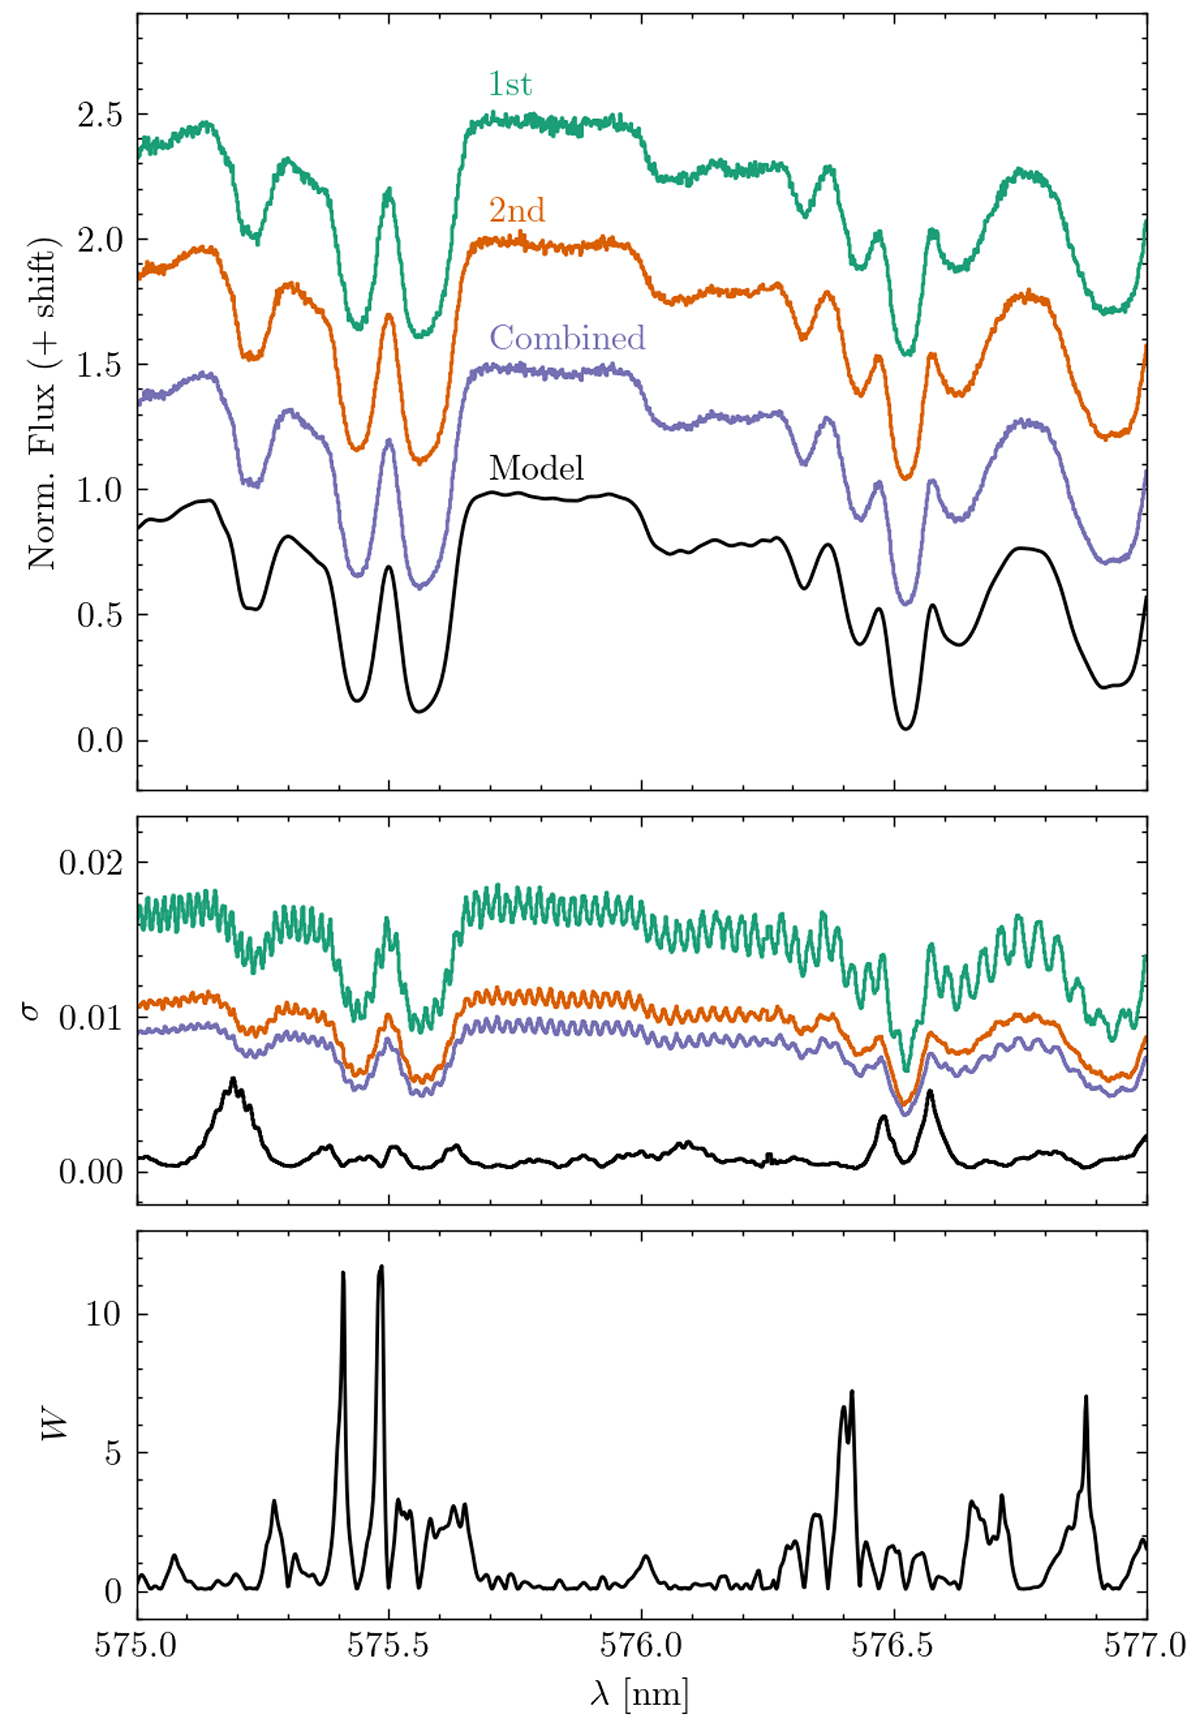
Section of the SB2 spectrum. Top panel: Normalised flux of the first epoch (green), second epoch (orange), and combined (purple) spectra. The mean model, ![]() , is shown as a solid black line. The spectra are shifted vertically for clarity. Middle panel: Normalised flux errors, σF, of the three spectra shown in the panel above, with the same colour coding. The solid black line is the standard deviation of our model,
, is shown as a solid black line. The spectra are shifted vertically for clarity. Middle panel: Normalised flux errors, σF, of the three spectra shown in the panel above, with the same colour coding. The solid black line is the standard deviation of our model, ![]() , i.e. it shows where our ensemble of models exhibits large variation, and hence uncertainty. Bottom panel: Normalised pixel weights, W, as defined in Eq. (12). Regions with higher values provide more constraints on our final ż measurement.
, i.e. it shows where our ensemble of models exhibits large variation, and hence uncertainty. Bottom panel: Normalised pixel weights, W, as defined in Eq. (12). Regions with higher values provide more constraints on our final ż measurement.
Current usage metrics show cumulative count of Article Views (full-text article views including HTML views, PDF and ePub downloads, according to the available data) and Abstracts Views on Vision4Press platform.
Data correspond to usage on the plateform after 2015. The current usage metrics is available 48-96 hours after online publication and is updated daily on week days.
Initial download of the metrics may take a while.