Open Access
Fig. 2.
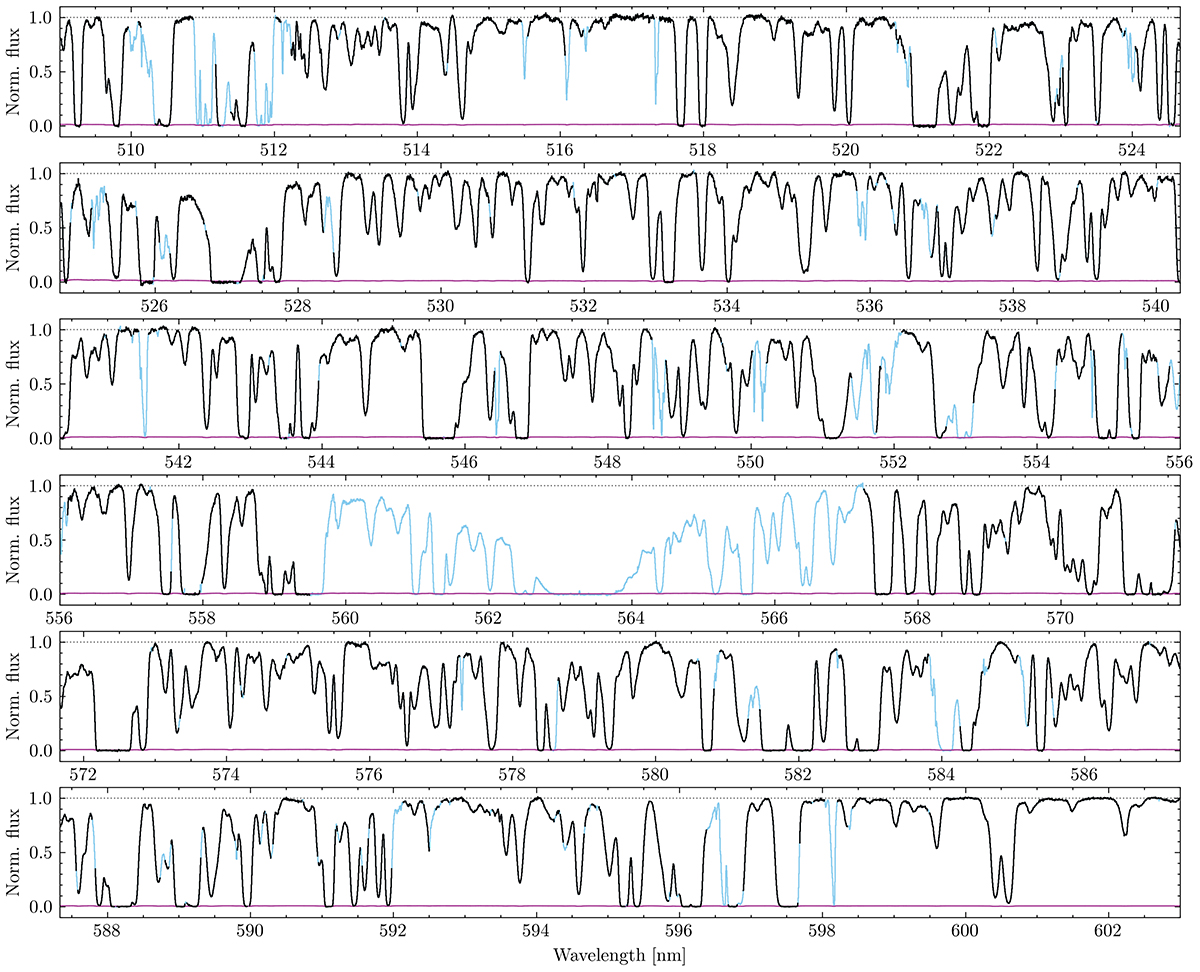
Download original image
Normalised transmitted flux of the Lyman-α forest in the combined spectrum of SB2 as a function of wavelength. The solid light blue line highlights the spectral regions masked due to metal absorption, the sub-DLA and bad pixels. The solid purple line reports the flux error.
Current usage metrics show cumulative count of Article Views (full-text article views including HTML views, PDF and ePub downloads, according to the available data) and Abstracts Views on Vision4Press platform.
Data correspond to usage on the plateform after 2015. The current usage metrics is available 48-96 hours after online publication and is updated daily on week days.
Initial download of the metrics may take a while.