Fig. 1.
Download original image
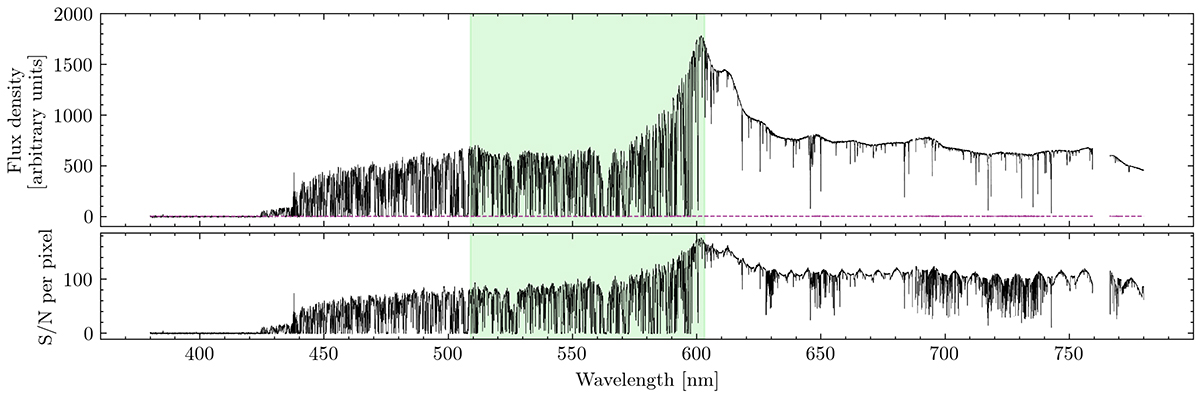
Combined spectrum of SB2. Top panel: Flux density in arbitrary units is shown in black, with the dashed purple line denoting the flux density error. Bottom panel: S/N per 1 km s−1 pixel. The shaded green area highlights the Lyman-α forest considered in the redshift drift measurement, bound by the Lyman-α and Lyman-β emissions of the quasar, namely between 509−603 m.
Current usage metrics show cumulative count of Article Views (full-text article views including HTML views, PDF and ePub downloads, according to the available data) and Abstracts Views on Vision4Press platform.
Data correspond to usage on the plateform after 2015. The current usage metrics is available 48-96 hours after online publication and is updated daily on week days.
Initial download of the metrics may take a while.