Fig. 9
Download original image
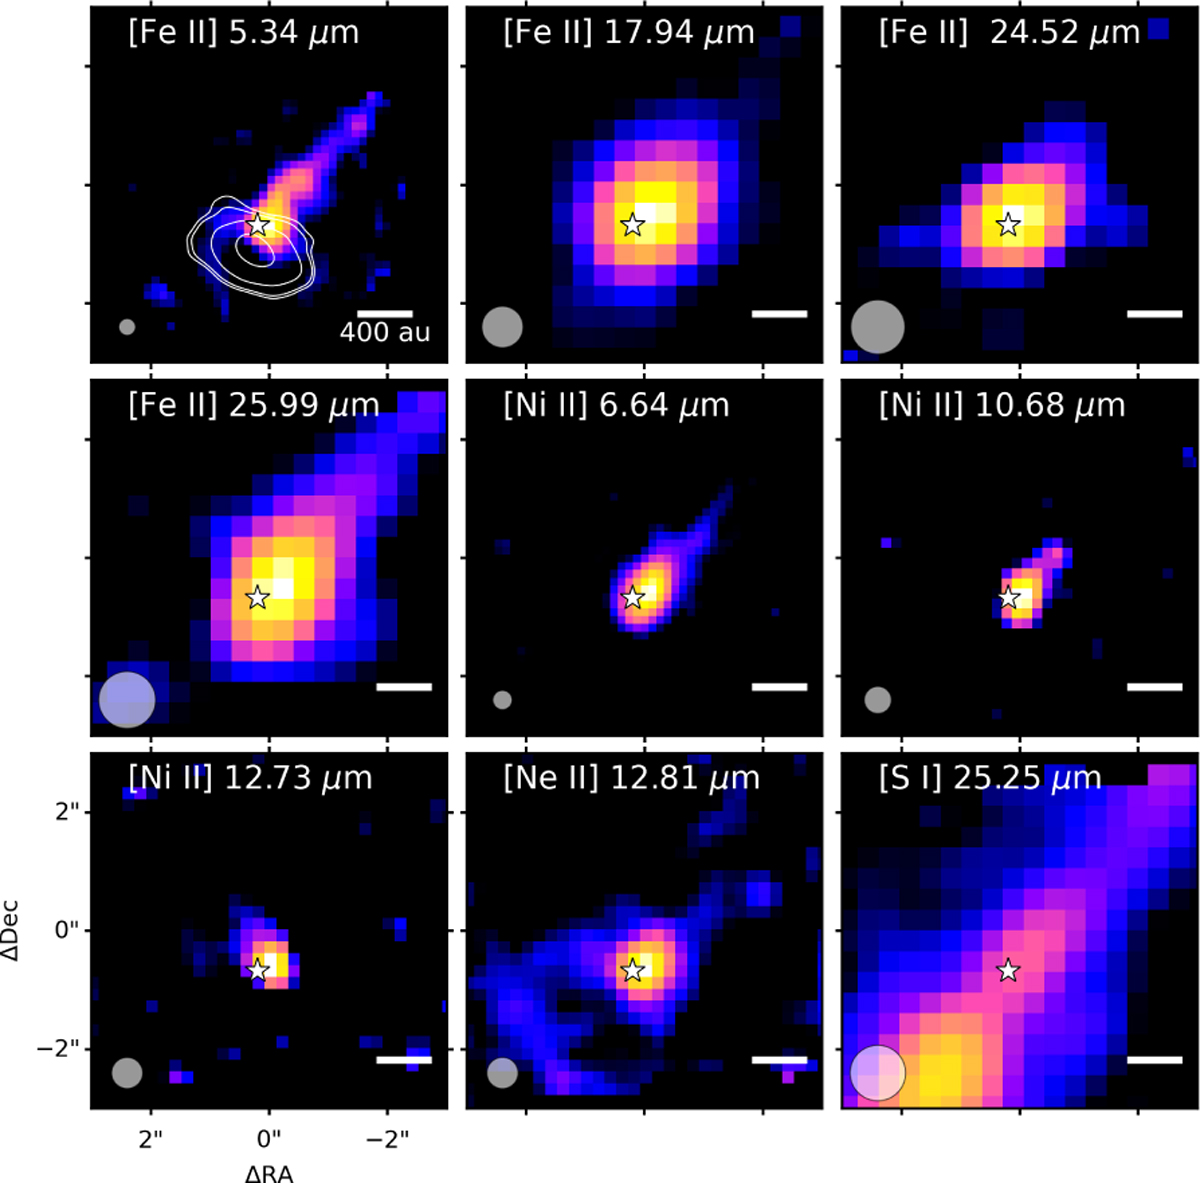
Maps from MIRI-MRS of various atoms and ions toward the Class 0 protostar Serpens SMM3. The white contours in the top-left panel outline the dust disk seen in millimeter continuum. Beam sizes are indicated in the lower left corner of each panel. Each panel is scaled to the maximum emission of that species. The maximum and minimum colors are (in Jy km s-1), from top left to bottom right: [Fe II] 5.34 (0.033, 0.003); [Fe II] 17.94 (0.84, 0.017); [Fe II] 24.52 (0.62, 0.025); [Fe II] 25.99 (1.86, 0.075); [Ni II] 6.64 (0.05, 0.002); [Ni II] 10.68 (0.006, 0.001); [Ni II] 12.73 (0.005, 0.001); [Ne II] 12.81 (0.017, 0.003); [S I] 25.25 (3.27, 0.033).
Current usage metrics show cumulative count of Article Views (full-text article views including HTML views, PDF and ePub downloads, according to the available data) and Abstracts Views on Vision4Press platform.
Data correspond to usage on the plateform after 2015. The current usage metrics is available 48-96 hours after online publication and is updated daily on week days.
Initial download of the metrics may take a while.