Fig. 6
Download original image
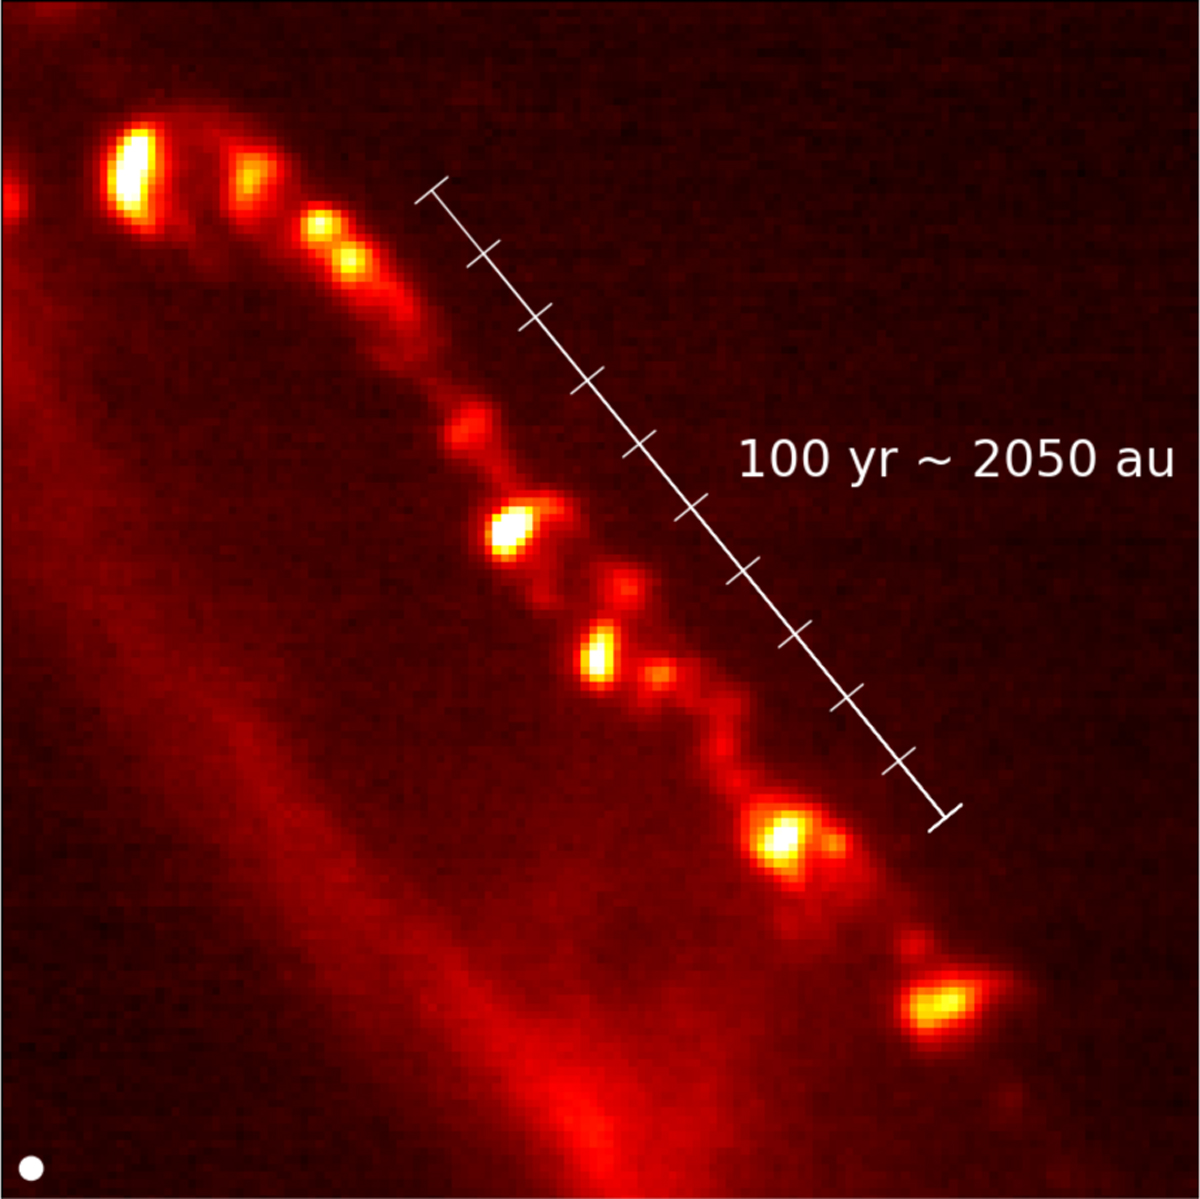
Blow-up of the H2 knots in part of the HH 211 jet in the blue out flow lobe imaged with the NIRCam F212N filter (Ray et al. 2023). This figure illustrates the typical separation between knots and thus implicitly the timescales between accretion bursts. The ruler shows the distance of jet gas covered in 100 yr when traveling at 100 km s-1, in 10 sections of 10 yr each.
Current usage metrics show cumulative count of Article Views (full-text article views including HTML views, PDF and ePub downloads, according to the available data) and Abstracts Views on Vision4Press platform.
Data correspond to usage on the plateform after 2015. The current usage metrics is available 48-96 hours after online publication and is updated daily on week days.
Initial download of the metrics may take a while.