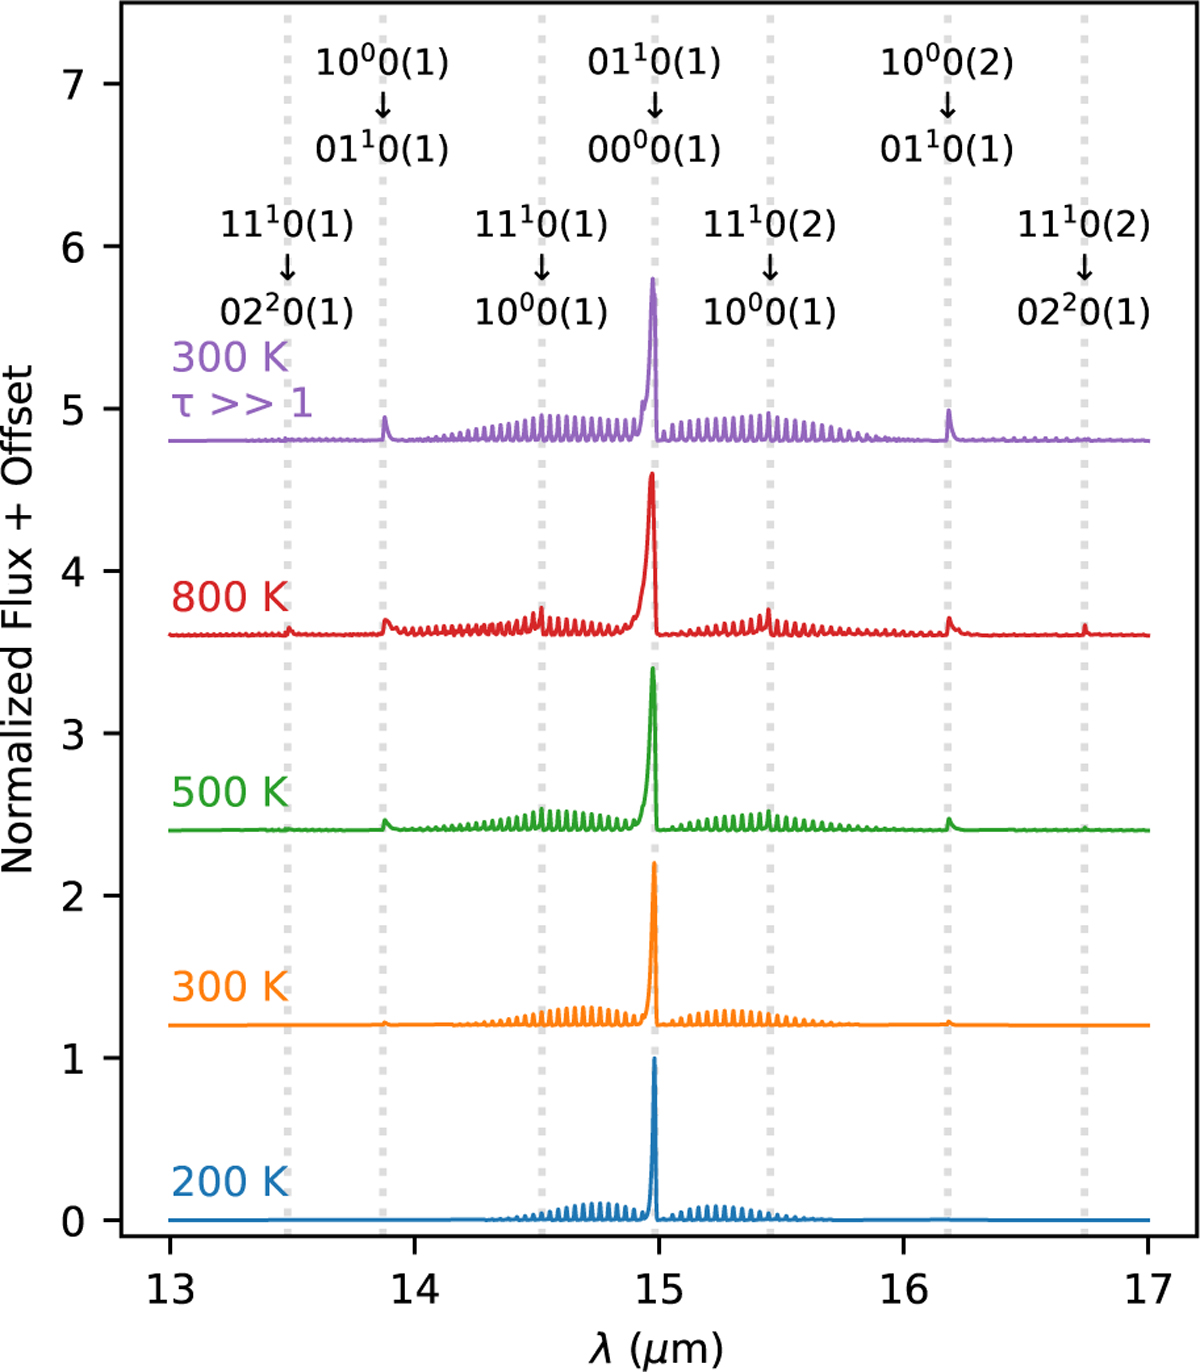
Fig. 5
Download original image
Simulated normalized CO2 mid-infrared spectra at different temperatures for optically thin emission (blue to red). Notable are the broadening of the Q branch and the appearance of hot bands (i.e., transitions between vibrationally excited states) with increasing temperature. These hot bands also become visible at lower temperatures when the CO2 Q-branch emission becomes optically thick (purple).
Current usage metrics show cumulative count of Article Views (full-text article views including HTML views, PDF and ePub downloads, according to the available data) and Abstracts Views on Vision4Press platform.
Data correspond to usage on the plateform after 2015. The current usage metrics is available 48-96 hours after online publication and is updated daily on week days.
Initial download of the metrics may take a while.