Fig. 27
Download original image
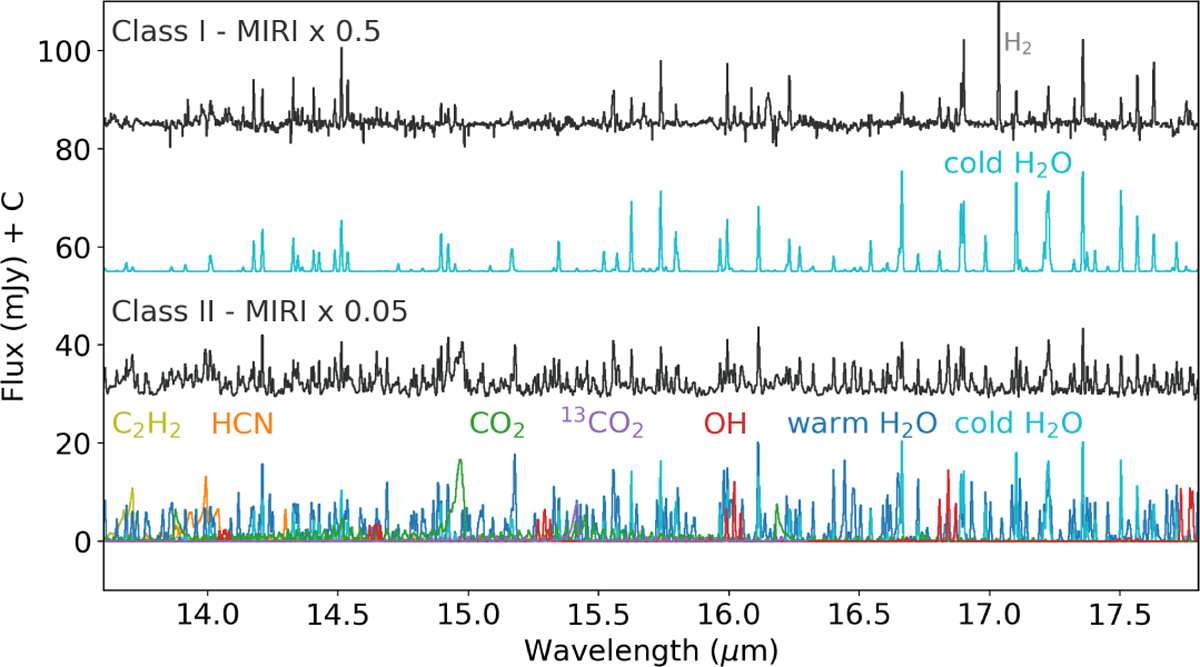
Spectra from MIRI-MRS at 13.5-17.5 μm of the Class I source B1-a-NS showing only cold water (van Gelder et al. 2024a) and of the Class II disk DF Tau showing it being rich in warm H2O and other molecules (Grant et al. 2024). The colored spectra show LTE slab models of individual molecules contributing to the observed spectra; they are meant to illustrate the positions of the lines, not as a fit to the data. The temperatures used on the H2O slab models are 190 K (cold) and 490 K (warm).
Current usage metrics show cumulative count of Article Views (full-text article views including HTML views, PDF and ePub downloads, according to the available data) and Abstracts Views on Vision4Press platform.
Data correspond to usage on the plateform after 2015. The current usage metrics is available 48-96 hours after online publication and is updated daily on week days.
Initial download of the metrics may take a while.