Fig. 25
Download original image
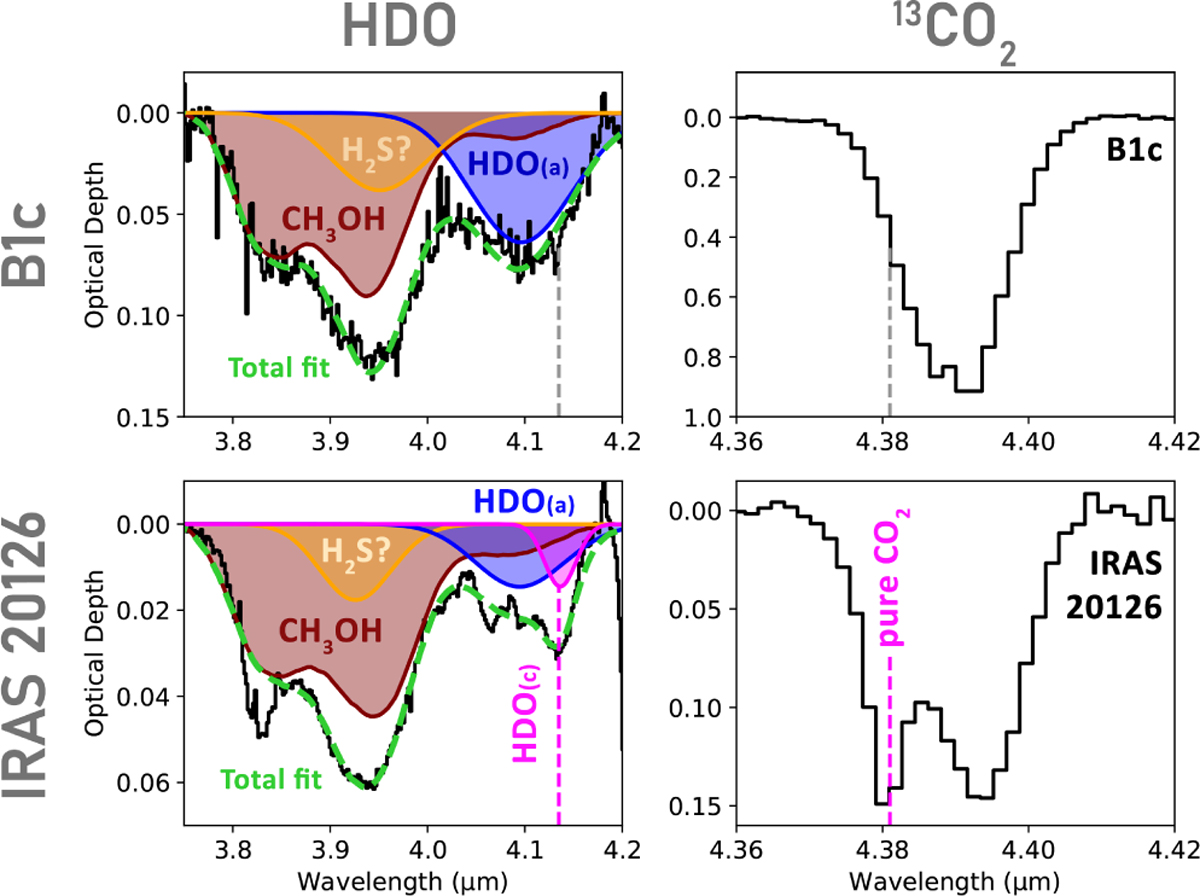
Top-left panel: JWST NIRSpec spectrum of B1-c in the 3.8 4.2 μm range highlighting the detection of HDO ice. Laboratory spectra of HDO amorphous ice (HDO(a)) as well as of CH3 OH ice are overlaid. A Gaussian has been added to represent an S-H ice feature. Top-right panel: Ice band of 13CO2 4.38 μm of B1-c highlighting the lack of a heated ice component. Bottom-left panel: JWST NIRSpec spectrum of the high mass protostar IRAS 20126 taken from Slavicinska et al. (2024) showing the detection of both amorphous and crystalline HDO ice. The laboratory spectrum of crystalline HDO ice is shown in pink (HDO(c)). Bottom-right panel: Ice band of 13CO2 4.38 μm of IRAS 20126 showing evidence of a heated ice component as analyzed by Brunken et al. (2024a).
Current usage metrics show cumulative count of Article Views (full-text article views including HTML views, PDF and ePub downloads, according to the available data) and Abstracts Views on Vision4Press platform.
Data correspond to usage on the plateform after 2015. The current usage metrics is available 48-96 hours after online publication and is updated daily on week days.
Initial download of the metrics may take a while.