Fig. 22
Download original image
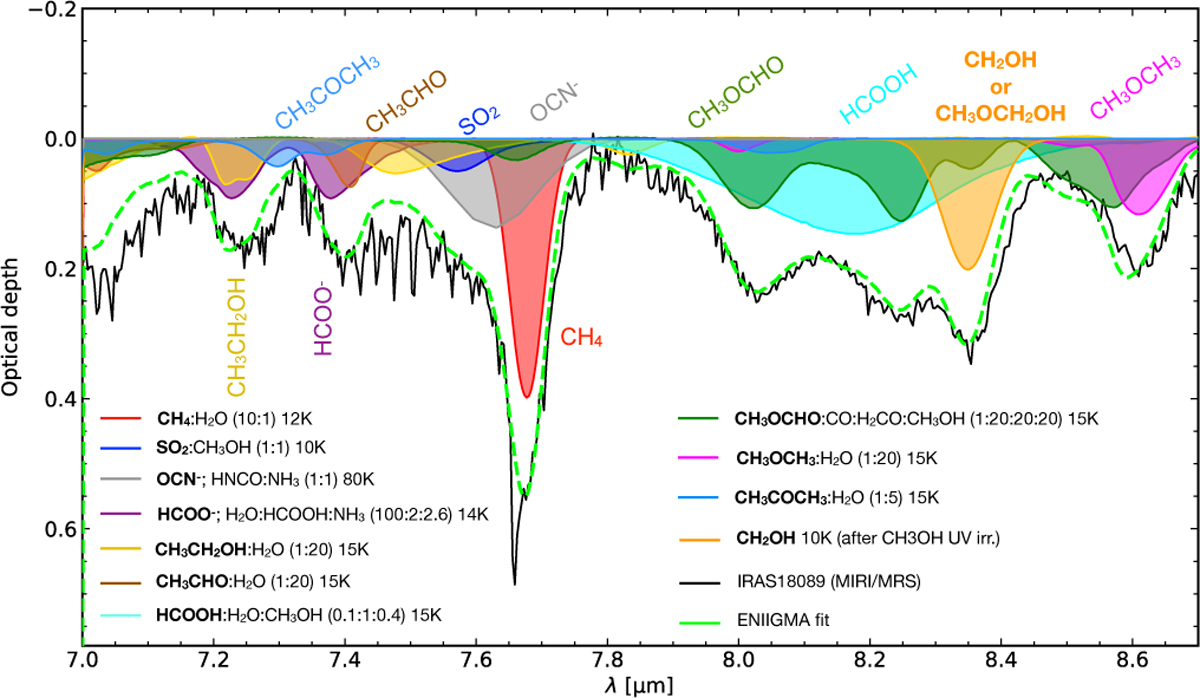
Spectral fit between 7 and 8.7 μm of IRAS 18089 using the ENIIGMA fitting tool with laboratory ice mixtures from the LIDA database. Eleven ice components were used to obtain the best fit, which includes simple and complex molecules in ice mixtures. The boldface in the labels of the lab spectra indicates the main species that contributes in this spectral range. The narrow weak absorption features between 7 and 8 μm are primarily due to warm gas-phase H2O; the narrow peak at 7.66 μm is due to gaseous CH4 absorption.
Current usage metrics show cumulative count of Article Views (full-text article views including HTML views, PDF and ePub downloads, according to the available data) and Abstracts Views on Vision4Press platform.
Data correspond to usage on the plateform after 2015. The current usage metrics is available 48-96 hours after online publication and is updated daily on week days.
Initial download of the metrics may take a while.