Fig. 21
Download original image
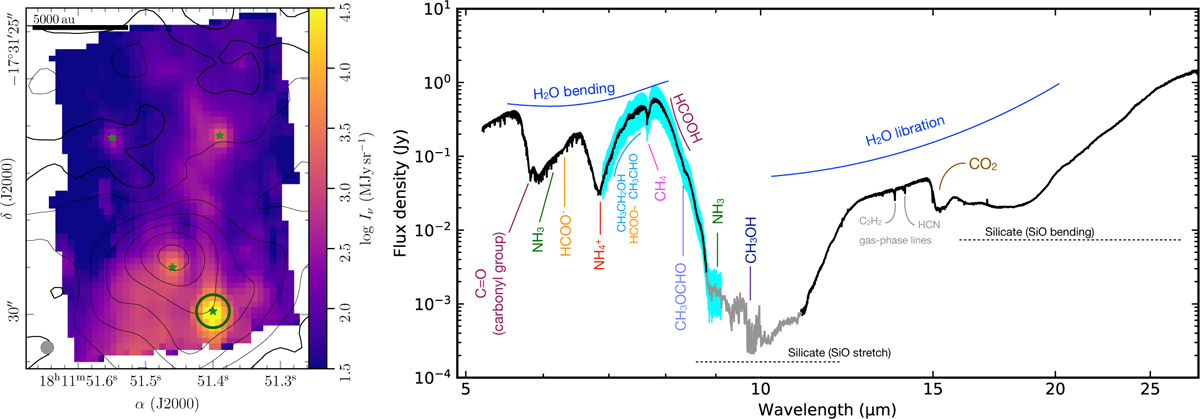
Left: MIRI-MRS 5 μm continuum image of the IRAS 18089-1732. The four compact sources are marked by green stars. The 0.7″ aperture used to extract the MIRI-MRS spectrum of the brightest mid-infrared source is indicated by a green circle. A scale bar of 5000 au is shown in the top and the angular resolution at 5 μm is shown in the bottom-left corner. Black contours are the ALMA 3 mm continuum emission taken from Gieser et al. (2023a) with contour steps at 5, 10, 20, 40, 80, 160, 320×σcont(σcont=0.057 mJy beam-1). Right: MIRI-MRS spectrum of IRAS 18089-1732. The main absorption features are annotated in the figure. Gas-phase lines are not labeled, except in the case of C2H2 and HCN at 13.7 and 14.0 μm. The cyan region between 7 and 9 μm is the spectral window analyzed in this work. Because of the low S/N in the deep silicate absorption, the data between 8.9 and 10 μm are binned by a factor of five.
Current usage metrics show cumulative count of Article Views (full-text article views including HTML views, PDF and ePub downloads, according to the available data) and Abstracts Views on Vision4Press platform.
Data correspond to usage on the plateform after 2015. The current usage metrics is available 48-96 hours after online publication and is updated daily on week days.
Initial download of the metrics may take a while.