Fig. 20
Download original image
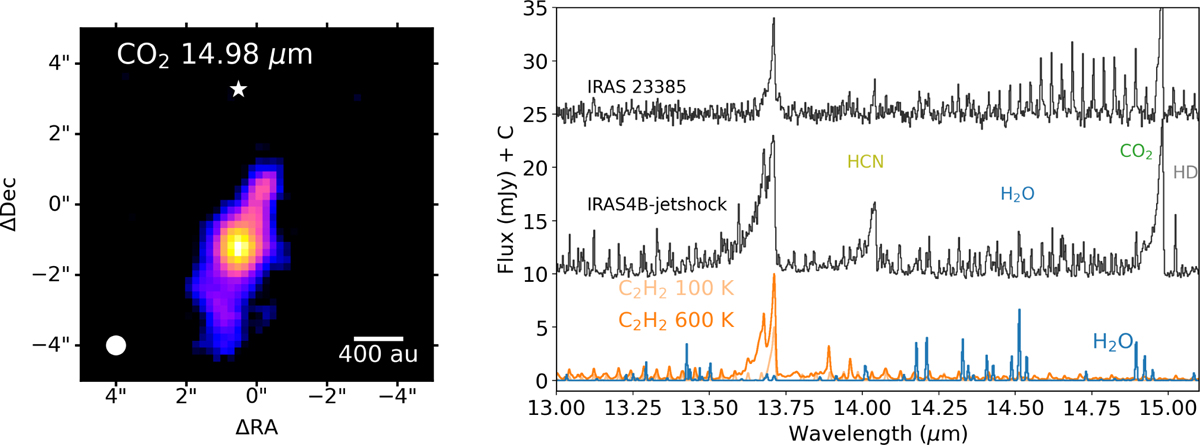
Left: MRS image of the CO2 15 μm band toward NGC 1333 IRAS4B showing the peak emission to be ~1000 au (~4″) offset from the source itself, whose position from millimeter interferometry is indicated by the white star. The beam size is indicated in the lower left corner. Right: MIRI-MRS spectrum of the NGC 1333 IRAS4B jet “knot” position in the 13-15 μm range highlighting its rich spectrum including hot C2H2 (600 K). For comparison, the spectrum of the high-mass protostar IRAS 23385, which shows only cold C2H2, is presented (Francis et al. 2024). The model spectra at the bottom show the contributions from C2H2 (100 and 600 K) and H2O (280 K) in this wavelength range.
Current usage metrics show cumulative count of Article Views (full-text article views including HTML views, PDF and ePub downloads, according to the available data) and Abstracts Views on Vision4Press platform.
Data correspond to usage on the plateform after 2015. The current usage metrics is available 48-96 hours after online publication and is updated daily on week days.
Initial download of the metrics may take a while.