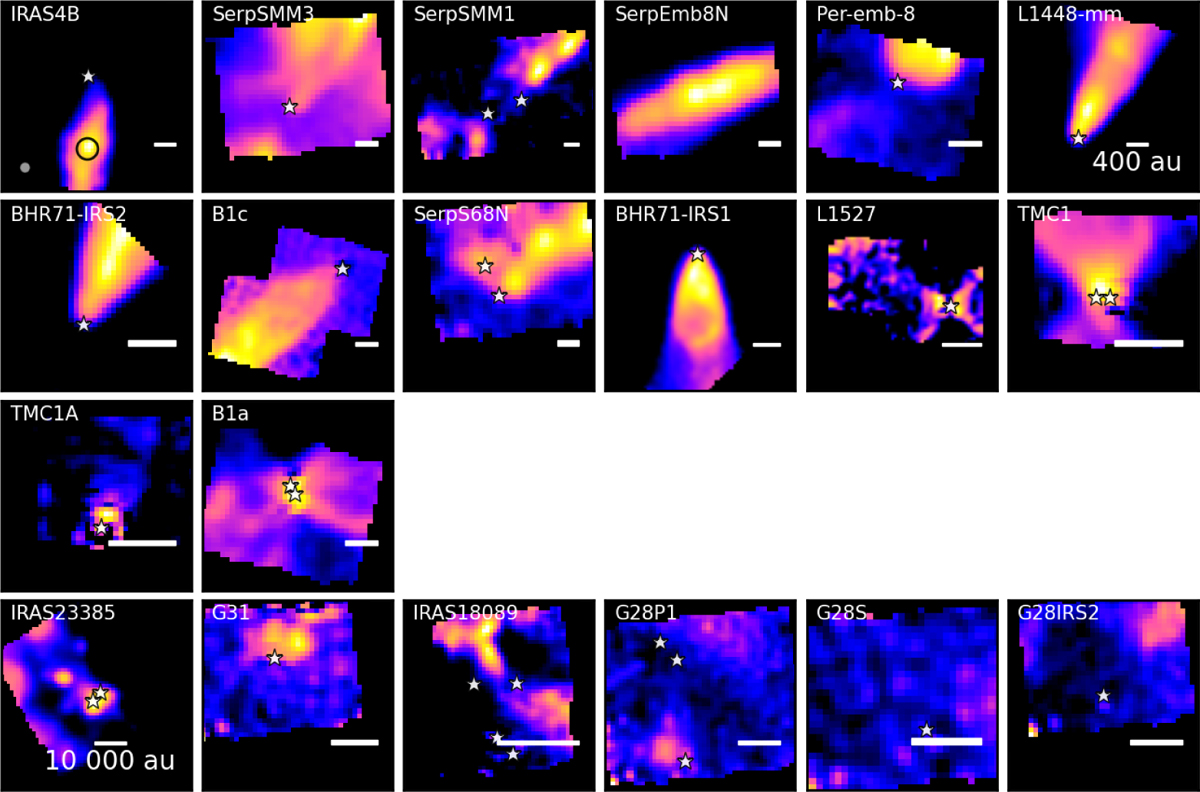
Fig. 13
Download original image
Maps from MIRI-MRS of the H2 S(1) line at 17.03 μm toward all JOYS sources. The top three rows show the low-mass protostars in order of increasing Tbol, whereas the bottom row shows the high-mass protostars. The white star(s) or arrow in each panel indicate the position of the protostar(s); for low-mass protostars those are derived from millimeter interferometry. A scale bar of 400 au is shown in each low-mass protostar panel, and a bar of 10 000 au in each high-mass protostar panel. The beam size is indicated in the lower left corner of the first panel. The maximum colors in each panel (in Jy km s-1) from the top left to bottom right for low mass are as follows: 0.59, 0.12, 0.03, 0.14, 0.08, 0.25, 0.08, 0.025, 0.041, 0.11, 0.006, 0.18, 0.31, 0.064. For high mass, they are 0.21, 0.02. 0.06, 0.021, 0.023, 0.027.
Current usage metrics show cumulative count of Article Views (full-text article views including HTML views, PDF and ePub downloads, according to the available data) and Abstracts Views on Vision4Press platform.
Data correspond to usage on the plateform after 2015. The current usage metrics is available 48-96 hours after online publication and is updated daily on week days.
Initial download of the metrics may take a while.