Fig. 5
Download original image
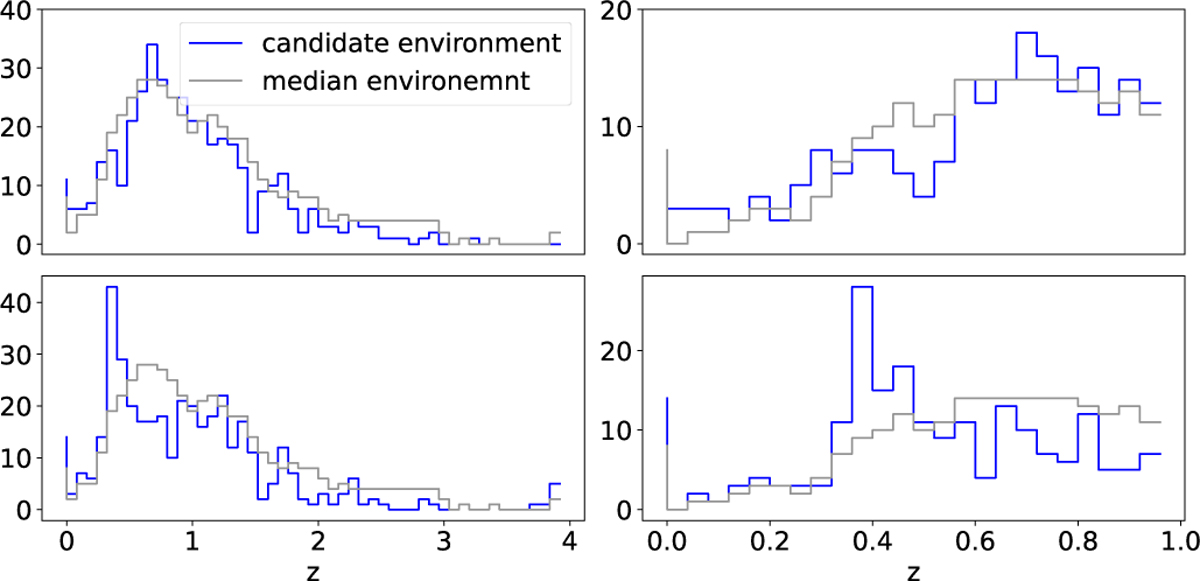
Histograms of the photometric redshifts within a box of 200″ on a side around two different lens candidates (top and bottom row) as examples. Such histograms, one in the range up to a redshift of 4 (left) and one up to a redshift of 1 (right), were shown during the visual inspection to ease the environment classification. The lens system in the top row has an environment similar to the median, whereas the system in the bottom row shows an overdensity at z ~ 0.4.
Current usage metrics show cumulative count of Article Views (full-text article views including HTML views, PDF and ePub downloads, according to the available data) and Abstracts Views on Vision4Press platform.
Data correspond to usage on the plateform after 2015. The current usage metrics is available 48-96 hours after online publication and is updated daily on week days.
Initial download of the metrics may take a while.