Fig. 4
Download original image
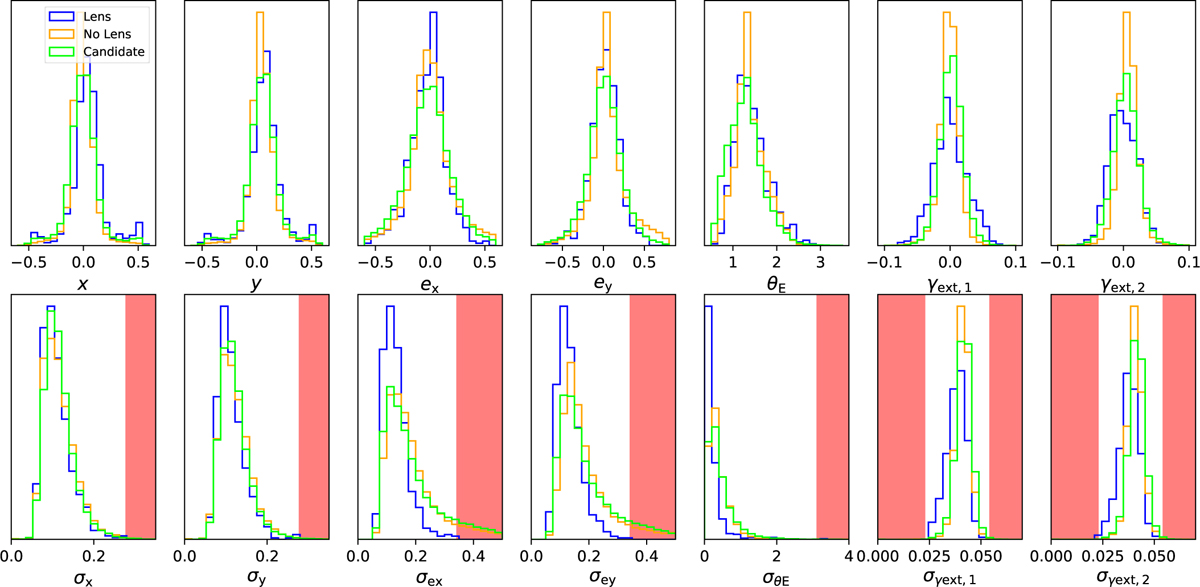
Normalized histograms of the mass model parameter predictions using the modeling network from S23a. The top row shows the predicted mass model parameter values, and the bottom row shows the corresponding 1 σ uncertainties. We show the 546 grade A and B lens candidates from C21 and S25 (blue), the visually rejected systems as non-lenses for comparison (orange), and those of the network candidates from our committee network of this work (green). The parameter ranges used to reject non-lenses are marked in red and defined by the highest and/or lowest uncertainty of the above-mentioned grade A and B lens sample (the small overlaps between the red regions and nonzero blue bins are merely due to the finite bin widths of the histograms).
Current usage metrics show cumulative count of Article Views (full-text article views including HTML views, PDF and ePub downloads, according to the available data) and Abstracts Views on Vision4Press platform.
Data correspond to usage on the plateform after 2015. The current usage metrics is available 48-96 hours after online publication and is updated daily on week days.
Initial download of the metrics may take a while.