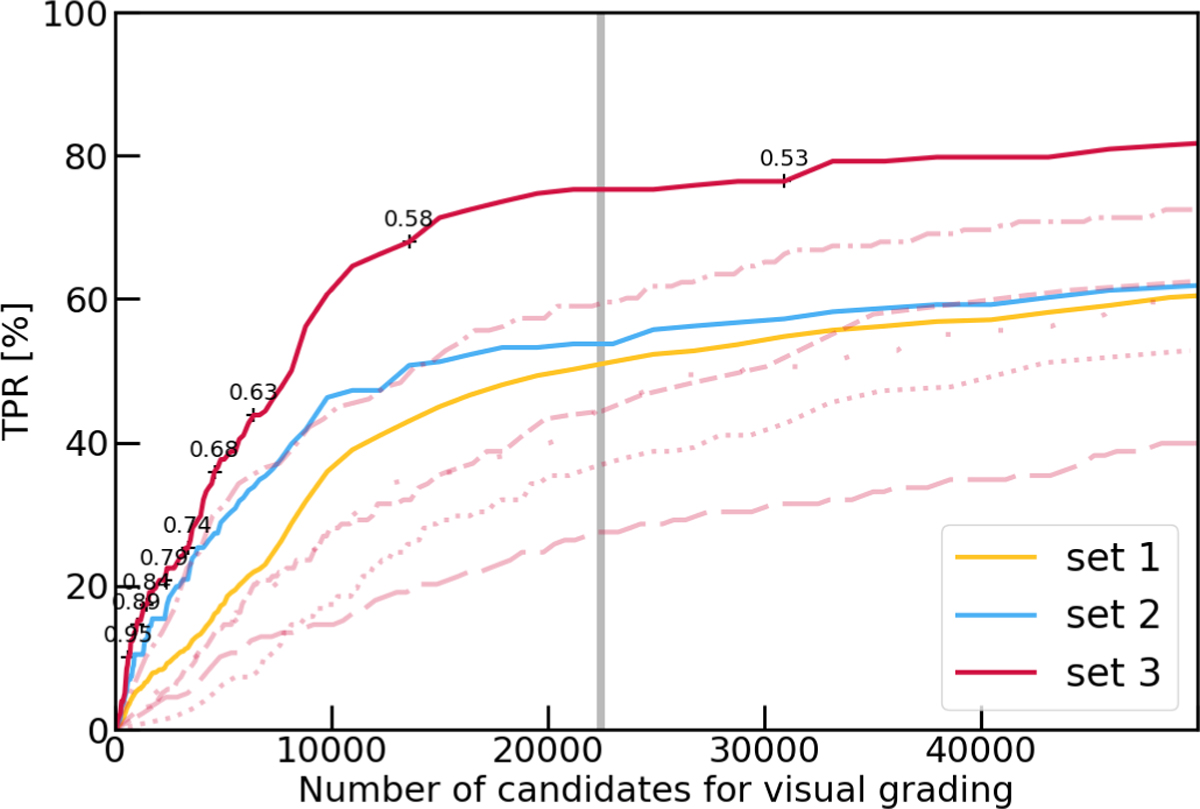
Fig. 2
Download original image
Evolution of the TPR, as measured over the three test sets of candidate and confirmed strong-lenses, as a function of the number of candidates selected by the neural networks. Solid curves show the results for the final committee of five networks trained on different ground-truth datasets. Light purple curves show the lower TPR obtained on set 3 for the five individual networks included in the committee: the ResNet from C21 (dashed curve), Classifier-1 from S22 (long-dotted curve), the baseline ResNet from C24 (dotted curve), a network trained on mocks with a natural θE distribution (dash-dotted curve), and a ResNet trained on balanced fraction of doubles and quads (long-dashed curve). The vertical gray line marks the final score threshold applied to select the list of strong-lens network candidates. Examples of score thresholds are marked for the evaluation of the best committee on set 3.
Current usage metrics show cumulative count of Article Views (full-text article views including HTML views, PDF and ePub downloads, according to the available data) and Abstracts Views on Vision4Press platform.
Data correspond to usage on the plateform after 2015. The current usage metrics is available 48-96 hours after online publication and is updated daily on week days.
Initial download of the metrics may take a while.