Fig. D.1
Download original image
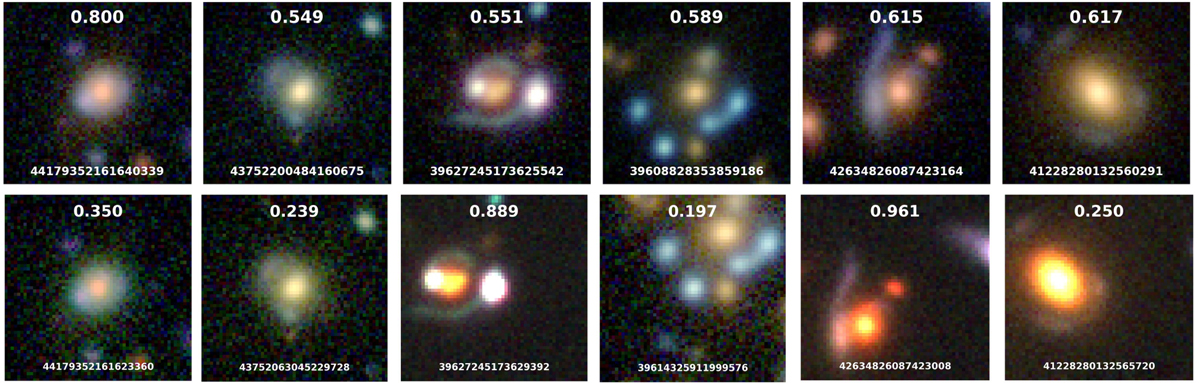
Color-images (gri) shown for visual inspection in this work (top row) and in S25 (bottom row) to visualize the minor difference between PDR3 (this work) and PDR2 (S25) and differences in the scaling of the individual filters because of the different cutout centering. We further show the network score (top of each panel) and the HSC ID (bottom).
Current usage metrics show cumulative count of Article Views (full-text article views including HTML views, PDF and ePub downloads, according to the available data) and Abstracts Views on Vision4Press platform.
Data correspond to usage on the plateform after 2015. The current usage metrics is available 48-96 hours after online publication and is updated daily on week days.
Initial download of the metrics may take a while.