Fig. 1
Download original image
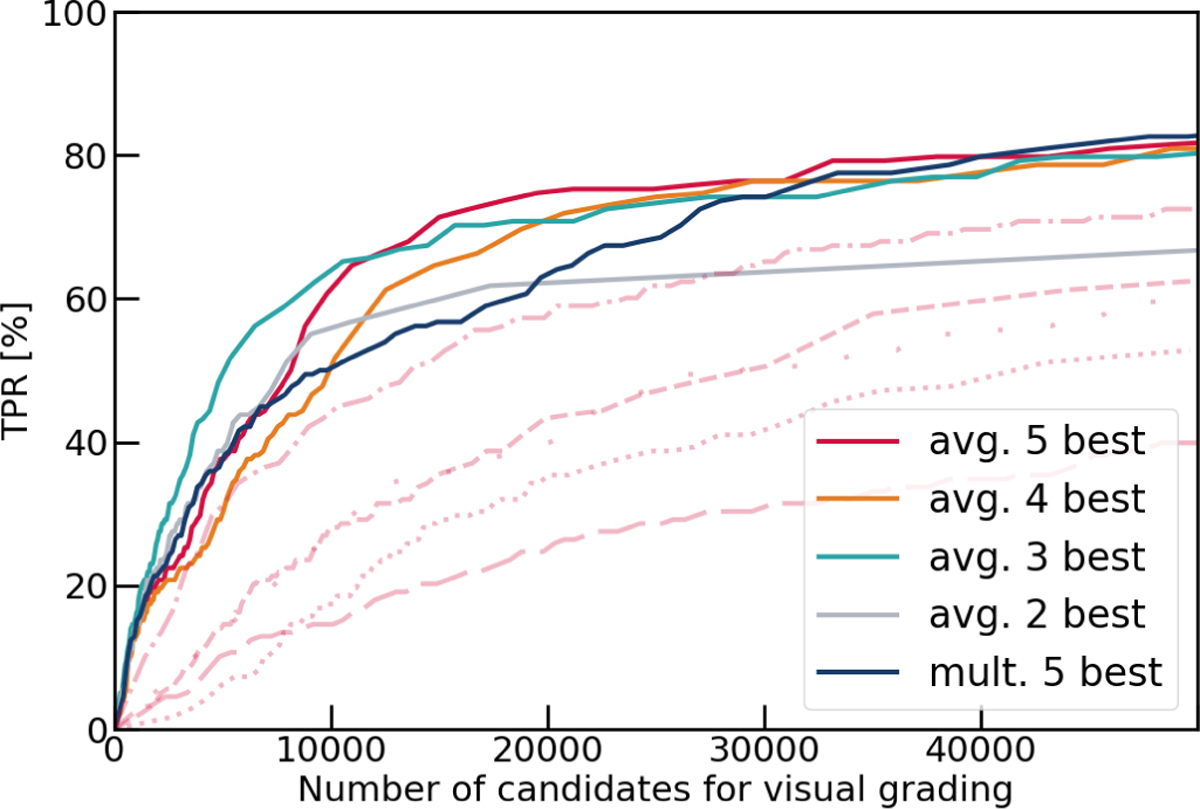
True-positive rate (TPR), giving the ratio between true-positives and all positives, of different network committees (solid lines) measured on set 3, as a function of the number of lens candidates selected by each committee over the parent sample of 110 million sources. We consider here five different networks, whose individual curves are shown in light purple of various line styles. As examples, we show the performance of the ResNet trained on sets L4 and N1 from C24 (dash-dotted) and Classifier-1 from S22 (long-dotted). The solid gray line shows the performance when averaging the scores from these two networks, the green one when additionally including the ResNet trained on L7 and N1 (long dashed), the orange one when also including the baseline ResNet from C24 (dotted), and red when additionally using the network from C21 (dashed). We further show the TPR evolution with a solid dark blue line when multiplying the network scores from all five networks instead of averaging.
Current usage metrics show cumulative count of Article Views (full-text article views including HTML views, PDF and ePub downloads, according to the available data) and Abstracts Views on Vision4Press platform.
Data correspond to usage on the plateform after 2015. The current usage metrics is available 48-96 hours after online publication and is updated daily on week days.
Initial download of the metrics may take a while.