Open Access
Fig. 2.
Download original image
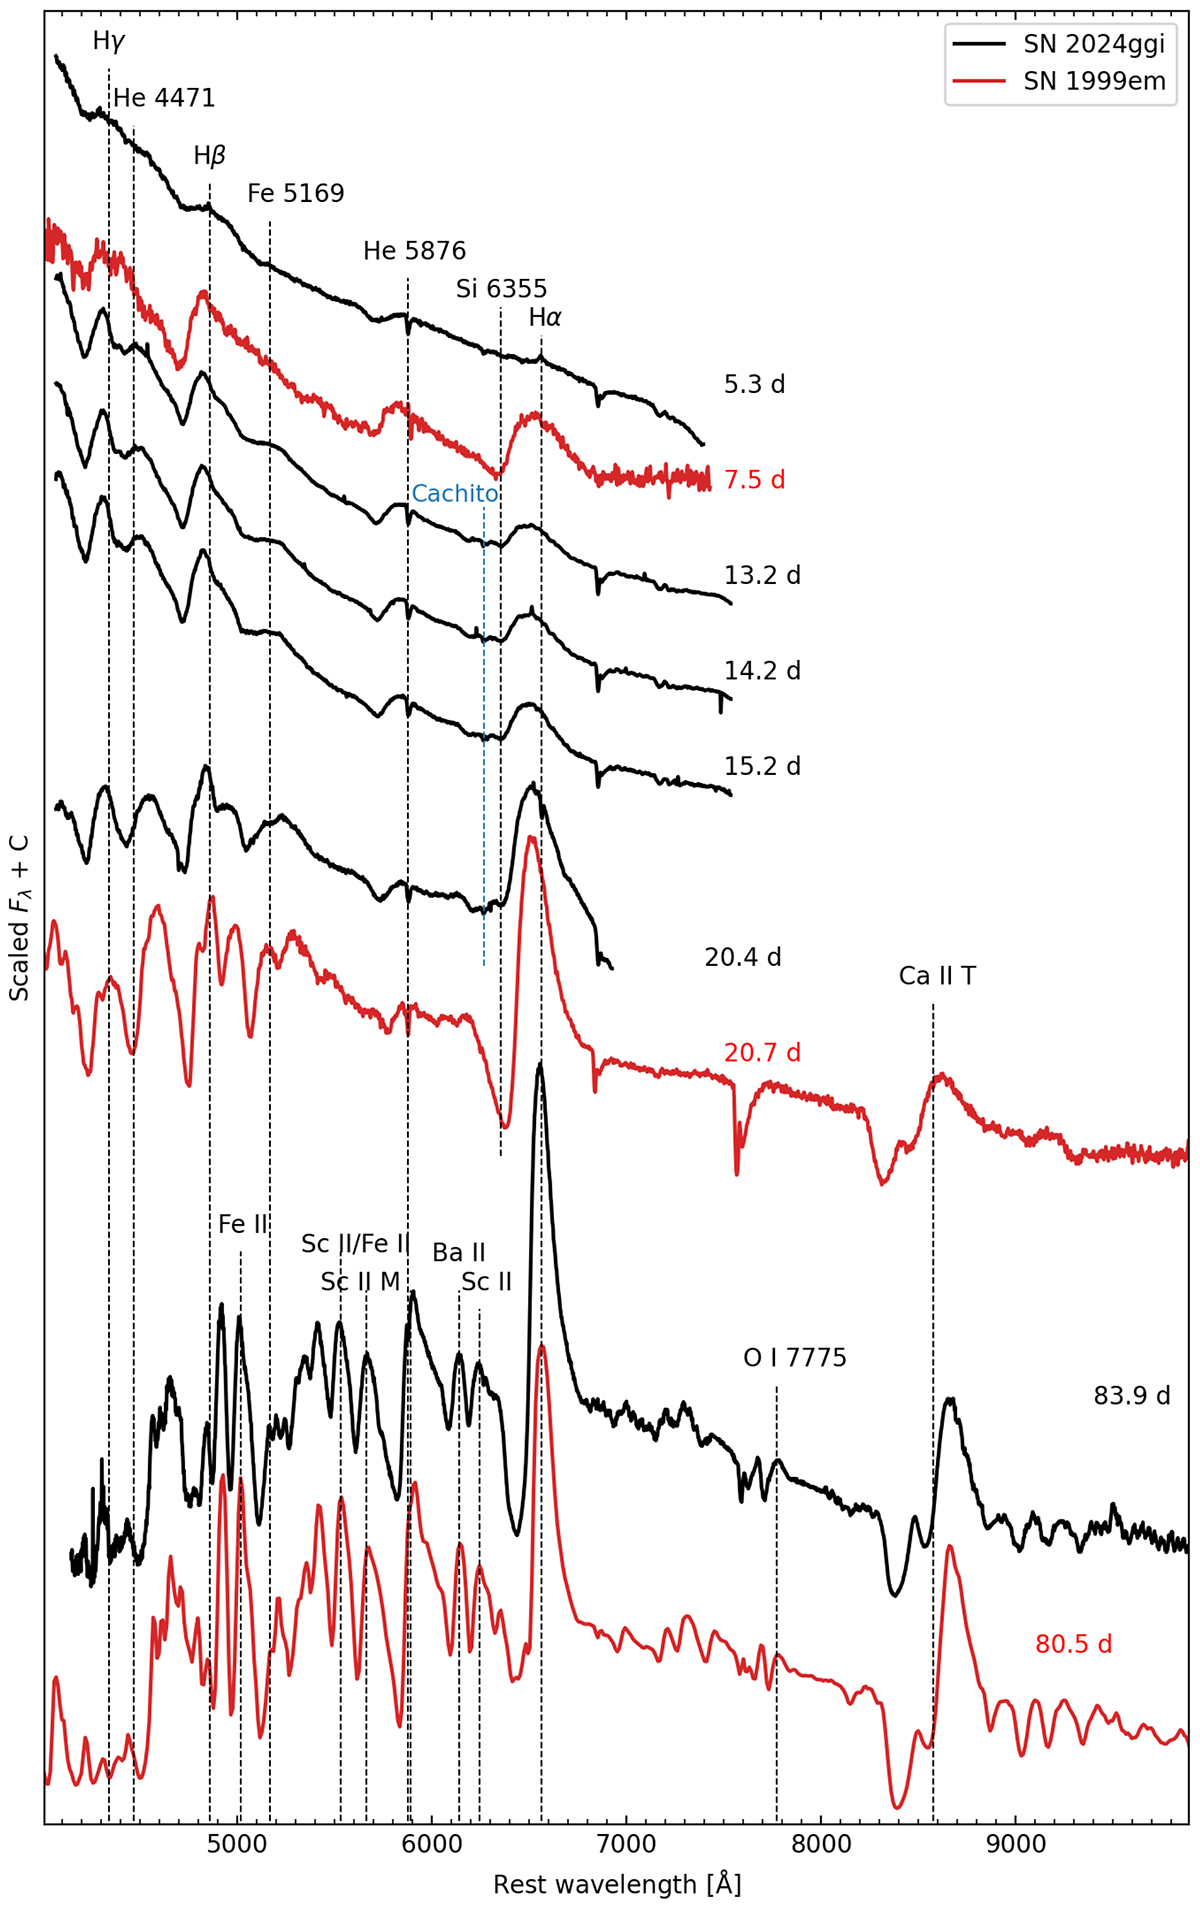
Spectral sequence of SN 2024ggi taken with the JS and Magellan Clay telescopes, marked in black. Main absorption lines are marked with dashed lines at the rest wavelength. Spectra of SN 1999em are shown for comparison in red; epochs are referred to the explosion date derived by Elmhamdi et al. (2003).
Current usage metrics show cumulative count of Article Views (full-text article views including HTML views, PDF and ePub downloads, according to the available data) and Abstracts Views on Vision4Press platform.
Data correspond to usage on the plateform after 2015. The current usage metrics is available 48-96 hours after online publication and is updated daily on week days.
Initial download of the metrics may take a while.