Open Access
Fig. 1.
Download original image
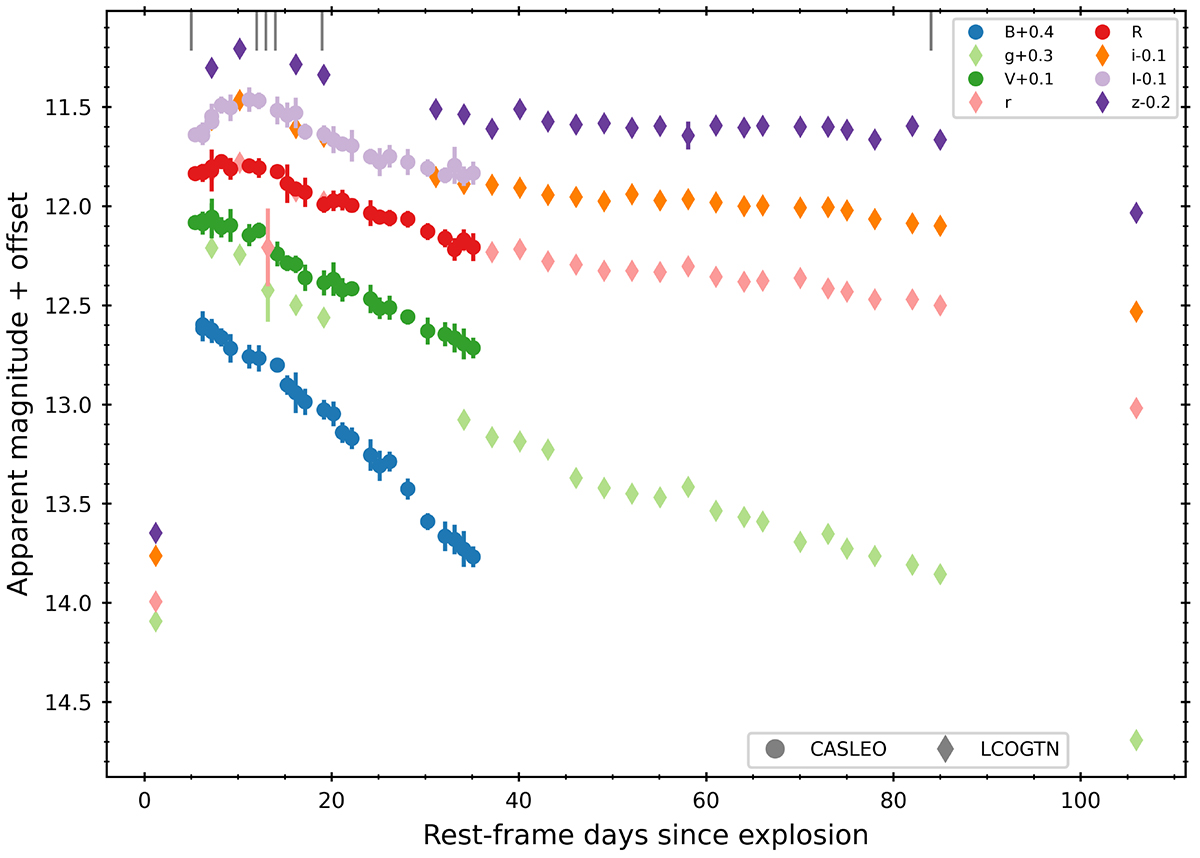
Observed LCs of SN 2024ggi. For clarity, the LCs are shifted by the offsets indicated in the upper legend. Different instruments are indicated with different markers. Rest-frame epochs of optical spectra are marked as grey lines along the top axis.
Current usage metrics show cumulative count of Article Views (full-text article views including HTML views, PDF and ePub downloads, according to the available data) and Abstracts Views on Vision4Press platform.
Data correspond to usage on the plateform after 2015. The current usage metrics is available 48-96 hours after online publication and is updated daily on week days.
Initial download of the metrics may take a while.