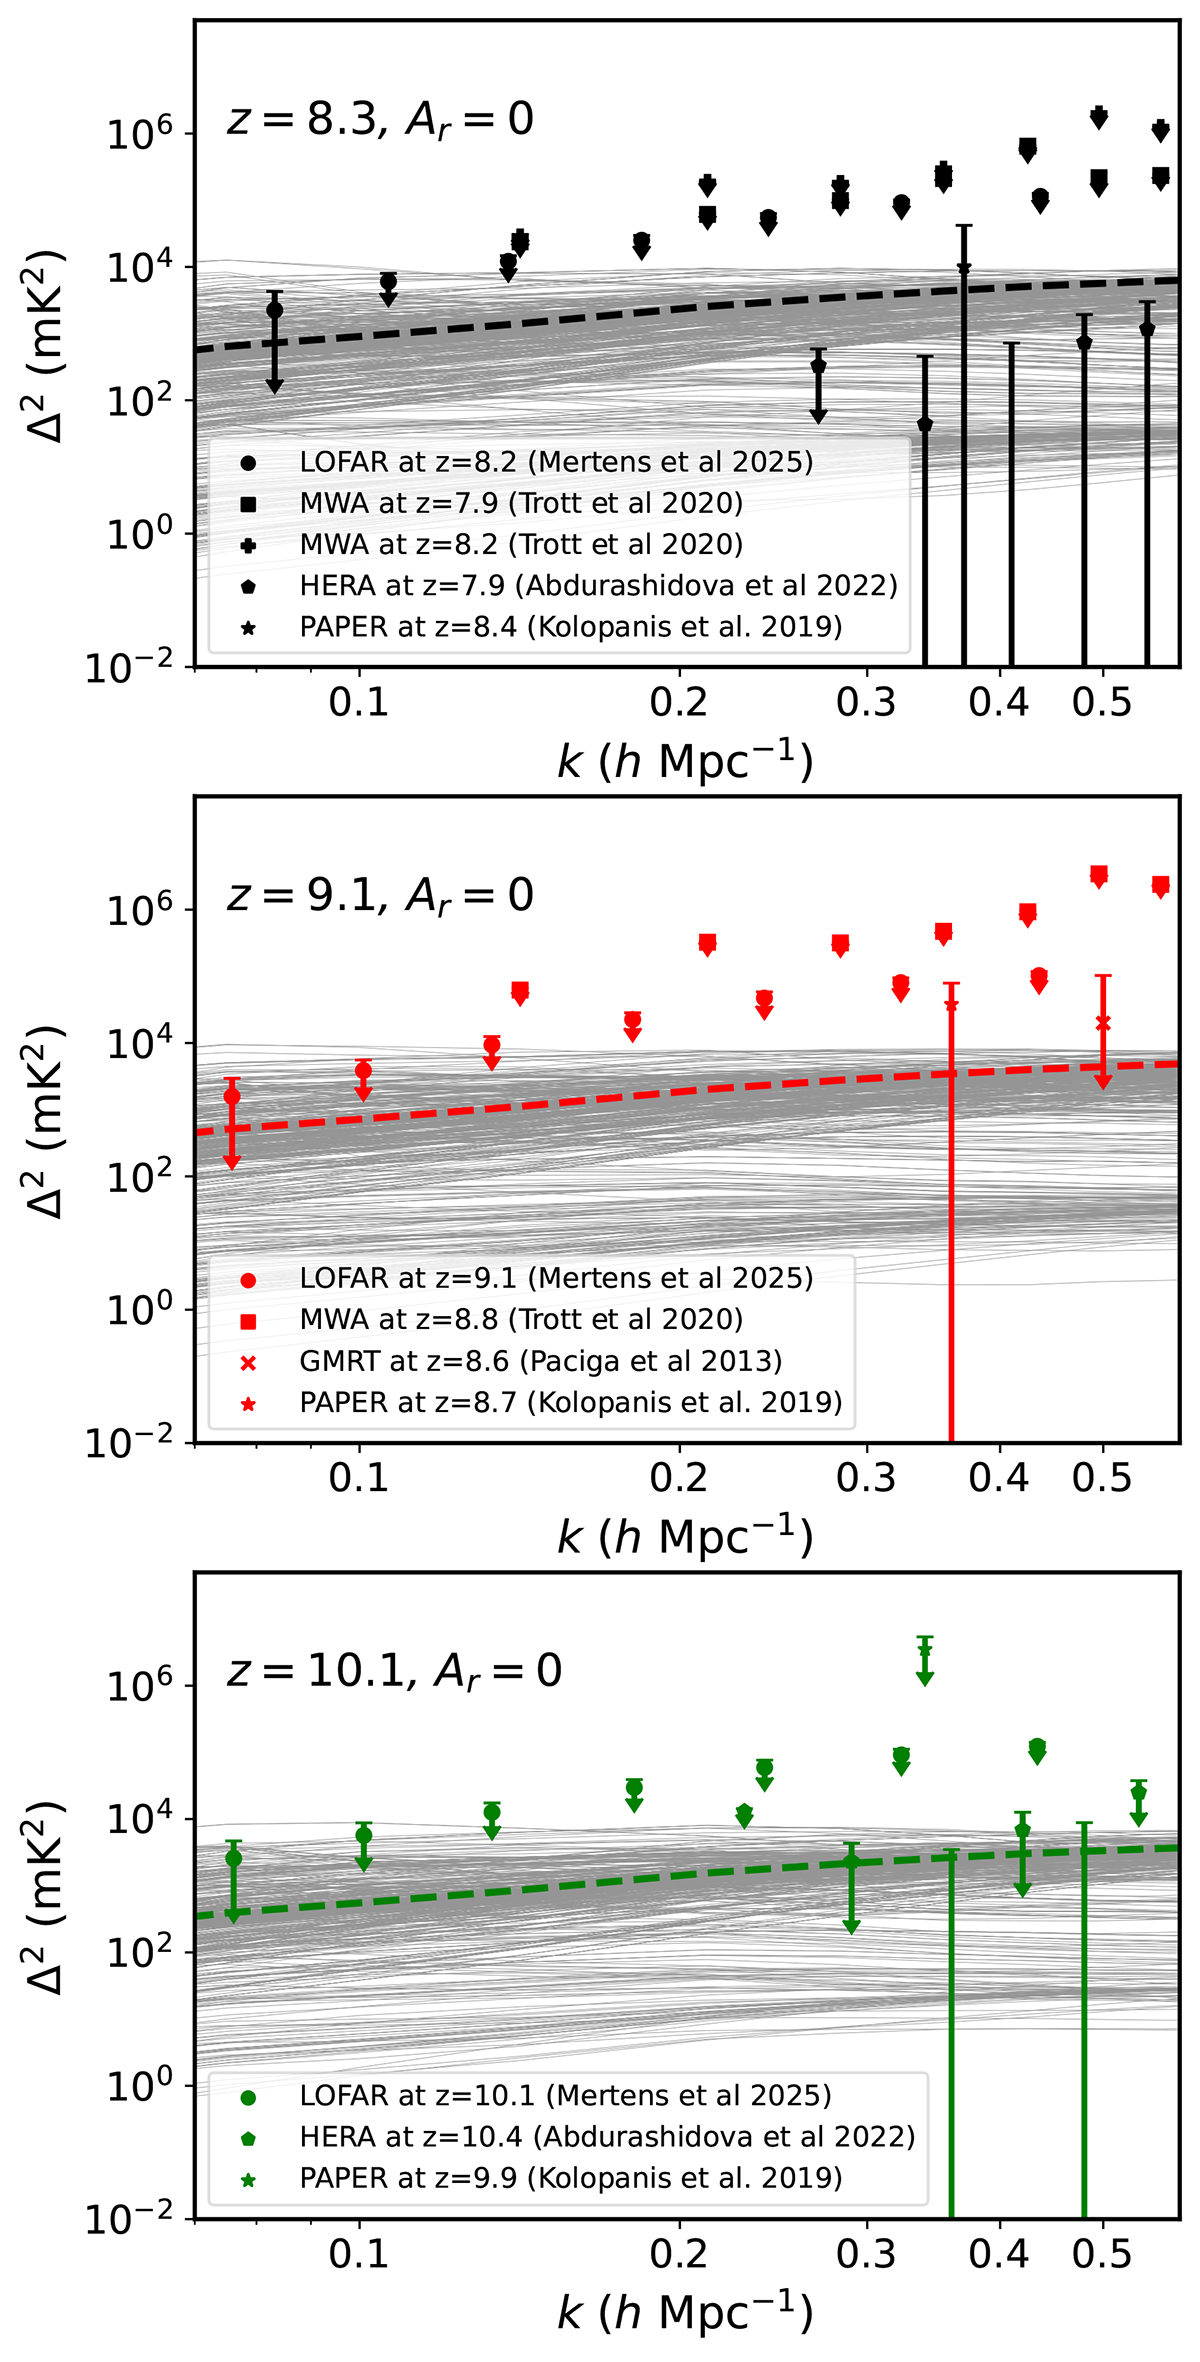
Fig. 9.
Download original image
Set of 1000 power spectra randomly chosen from the 105 simulated spectra for Ar = 0 scenario. Panels from top to bottom refer to z = 8.3, 9.1, and 10.1, respectively. The dashed lines correspond to the power spectrum for a completely neutral IGM with no X-ray heating and with TS = TK at those redshifts. The down arrow points refer to the different 2σ upper limits at those redshifts.
Current usage metrics show cumulative count of Article Views (full-text article views including HTML views, PDF and ePub downloads, according to the available data) and Abstracts Views on Vision4Press platform.
Data correspond to usage on the plateform after 2015. The current usage metrics is available 48-96 hours after online publication and is updated daily on week days.
Initial download of the metrics may take a while.