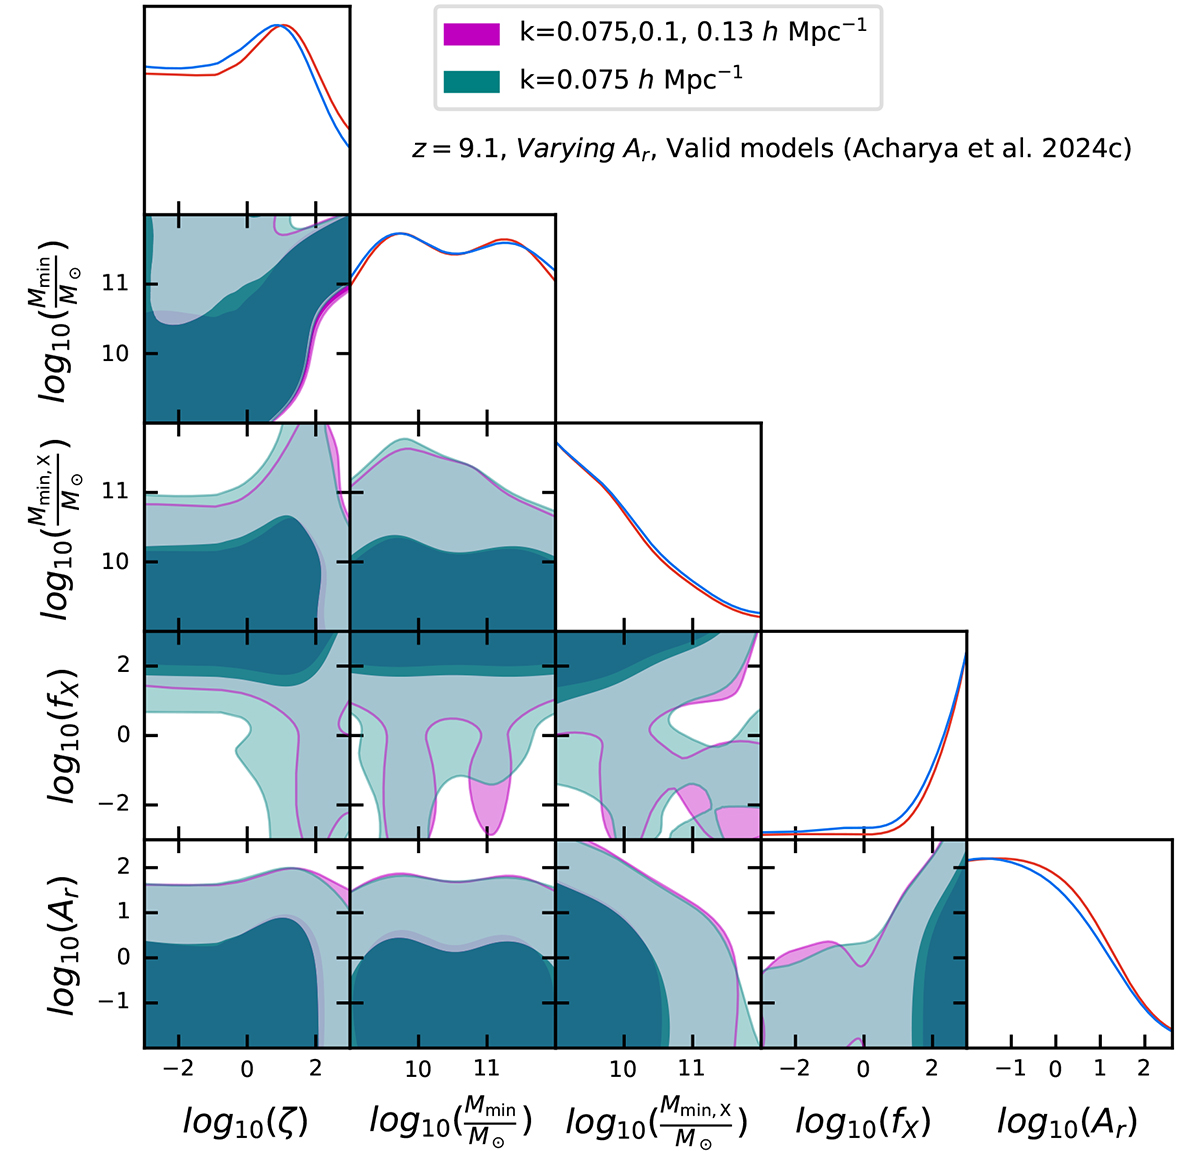
Fig. C.2.
Download original image
Posterior distribution of the source parameters at z = 9.1 for the Varying Ar scenario. These models are favoured by the LOFAR upper limits from Acharya et al. (2024c). Magenta indicates the case in which upper limits in three k−bins are considered, while teal represents the case when only one k−bin is used. The contour levels in the two-dimensional contour plots refer to the 1σ and 2σ credible intervals of the models favoured by the LOFAR upper limit at this redshift. The diagonal panels represent the corresponding marginalised probability distributions of each parameter.
Current usage metrics show cumulative count of Article Views (full-text article views including HTML views, PDF and ePub downloads, according to the available data) and Abstracts Views on Vision4Press platform.
Data correspond to usage on the plateform after 2015. The current usage metrics is available 48-96 hours after online publication and is updated daily on week days.
Initial download of the metrics may take a while.