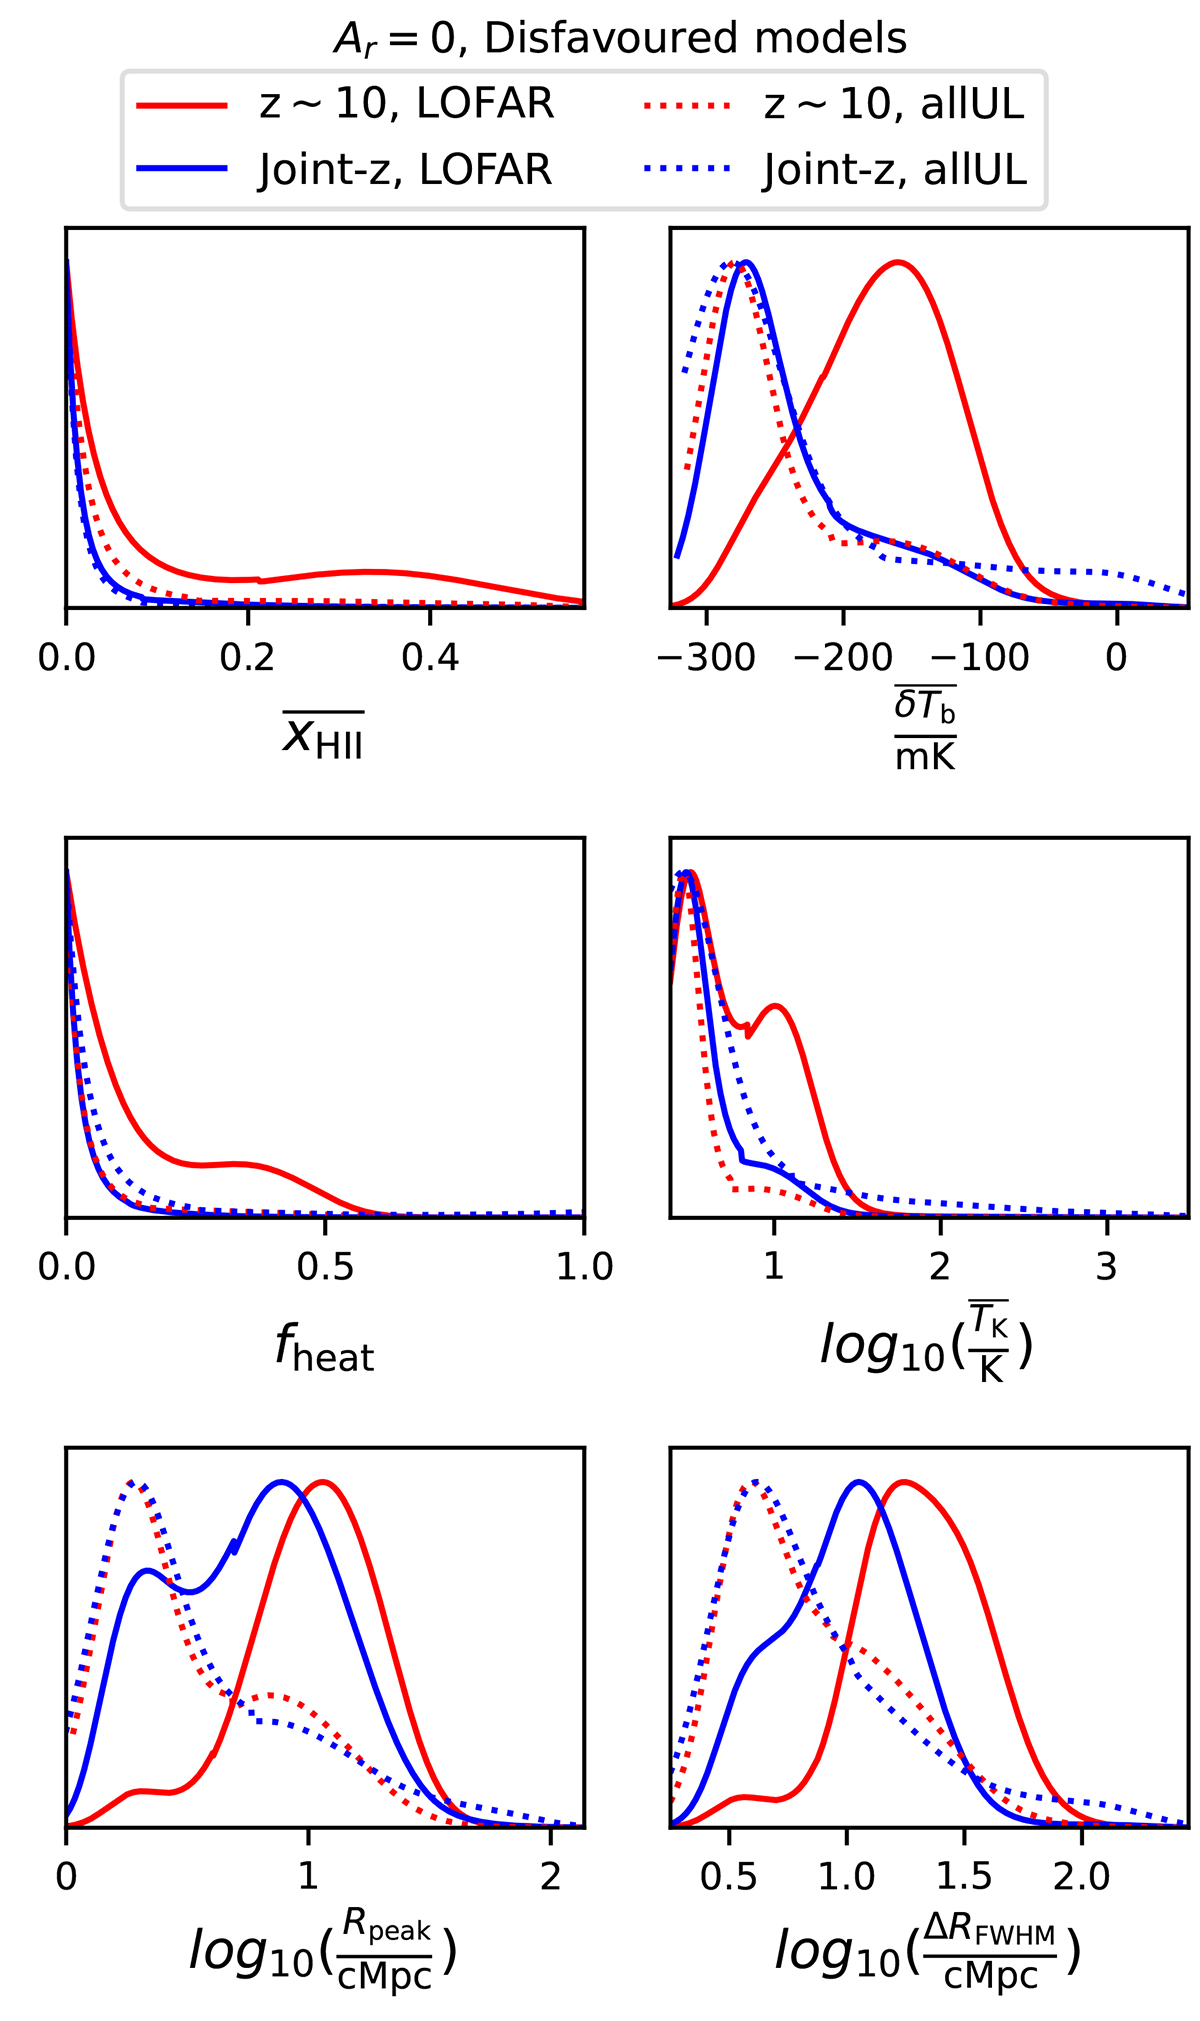
Fig. B.2.
Download original image
Marginalised probability distribution of the disfavoured models’ IGM parameters at z ∼ 10 for the allUL and Ar = 0 scenario. The red and blue curves refer to the Single-z and Joint-z cases, respectively. The solid curves represent results when we consider LOFAR upper limits only, while the dotted curves refer to cases where we have used all available upper limit results from different radio interferometric observations.
Current usage metrics show cumulative count of Article Views (full-text article views including HTML views, PDF and ePub downloads, according to the available data) and Abstracts Views on Vision4Press platform.
Data correspond to usage on the plateform after 2015. The current usage metrics is available 48-96 hours after online publication and is updated daily on week days.
Initial download of the metrics may take a while.