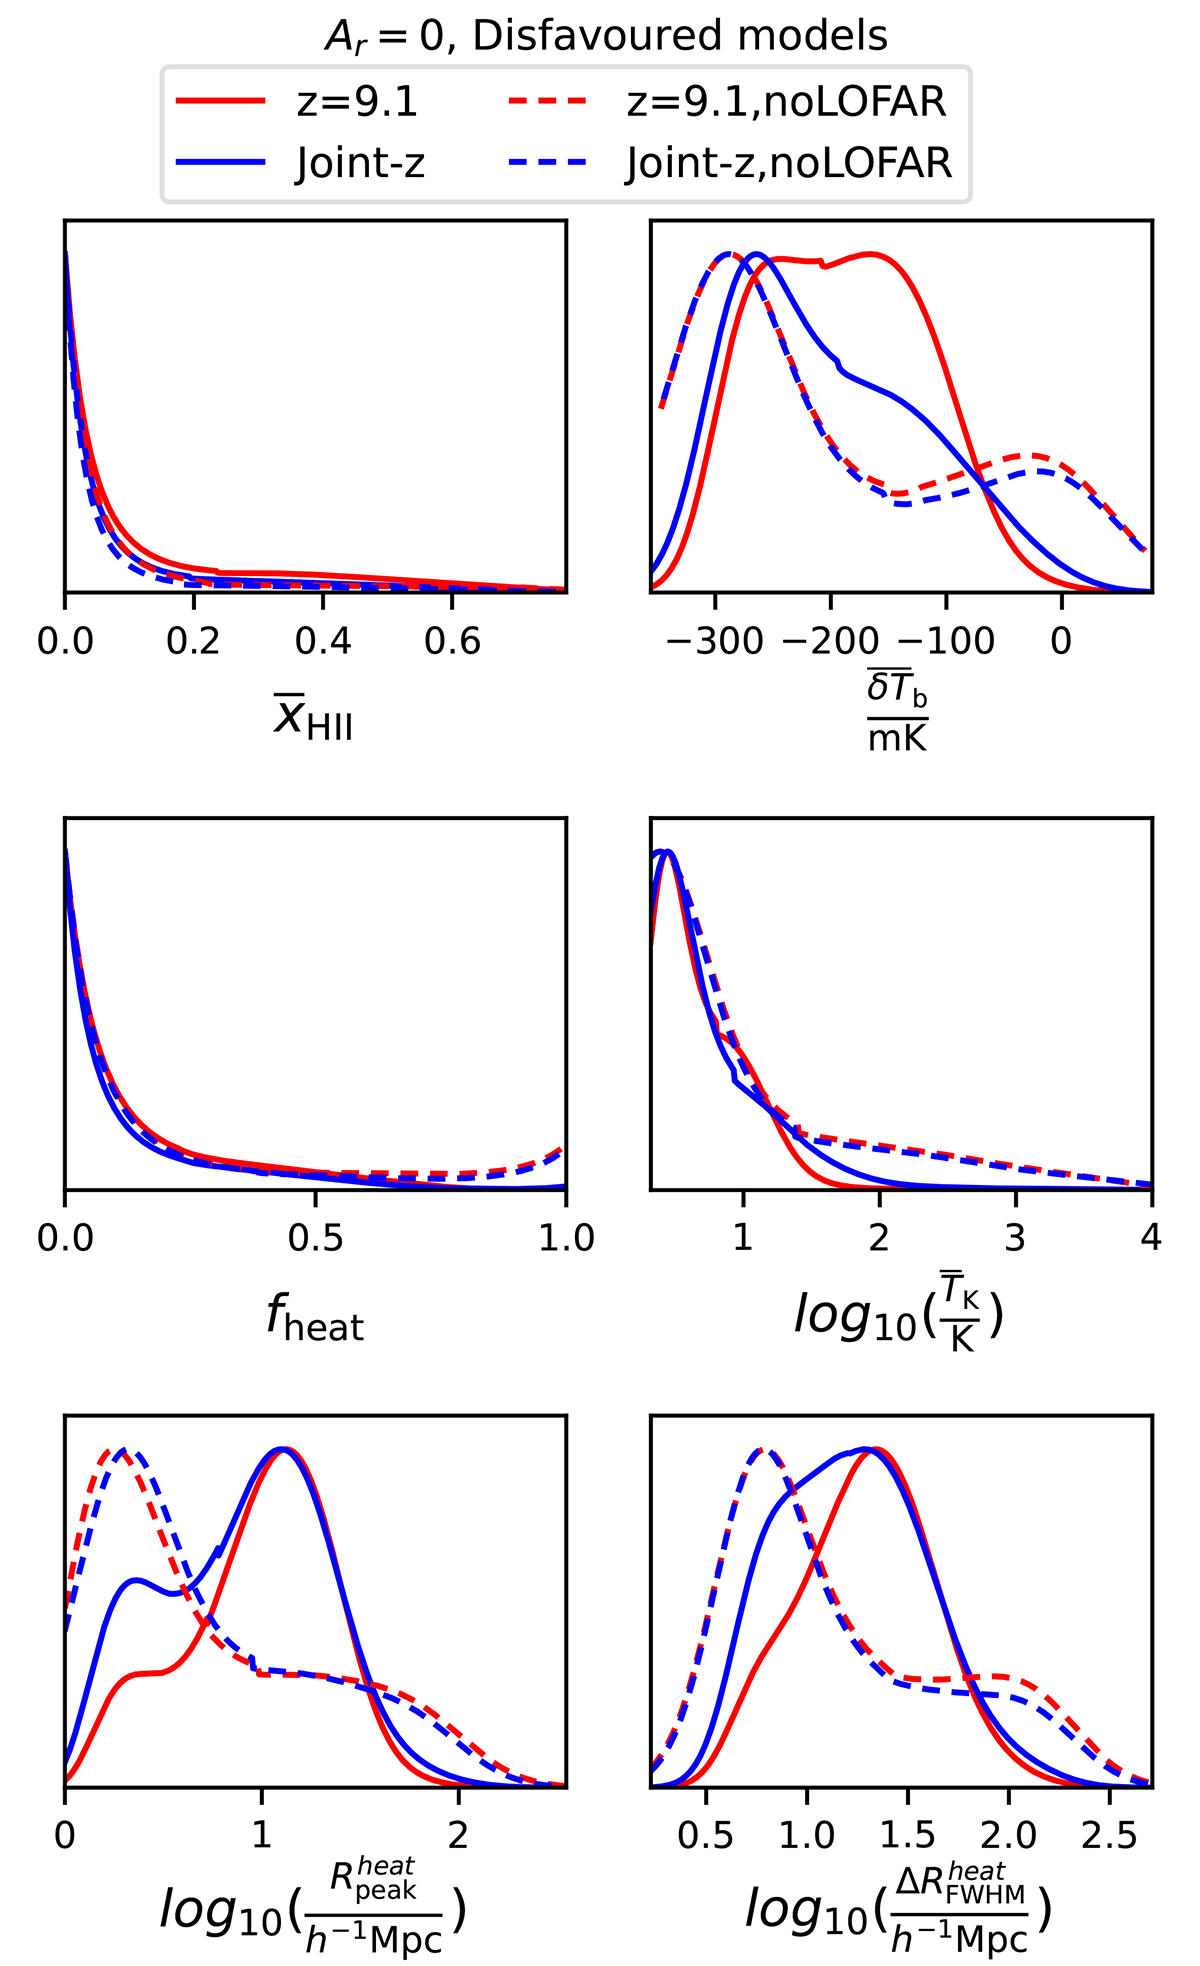
Fig. A.1.
Download original image
Marginalised probability distribution of the IGM parameters of the disfavoured models for a constant exclusion likelihood. The red and blue curves refer to the Single-z and Joint-z cases at z = 9.1, respectively. The solid curves represent results from the main text, while the dashed refers to cases where we have used ℒex, single − z(θ, z = 9.1) = 0.5 and ℒex, joint − z(θ, z = 9.1) = 0.5.
Current usage metrics show cumulative count of Article Views (full-text article views including HTML views, PDF and ePub downloads, according to the available data) and Abstracts Views on Vision4Press platform.
Data correspond to usage on the plateform after 2015. The current usage metrics is available 48-96 hours after online publication and is updated daily on week days.
Initial download of the metrics may take a while.