Fig. 1.
Download original image
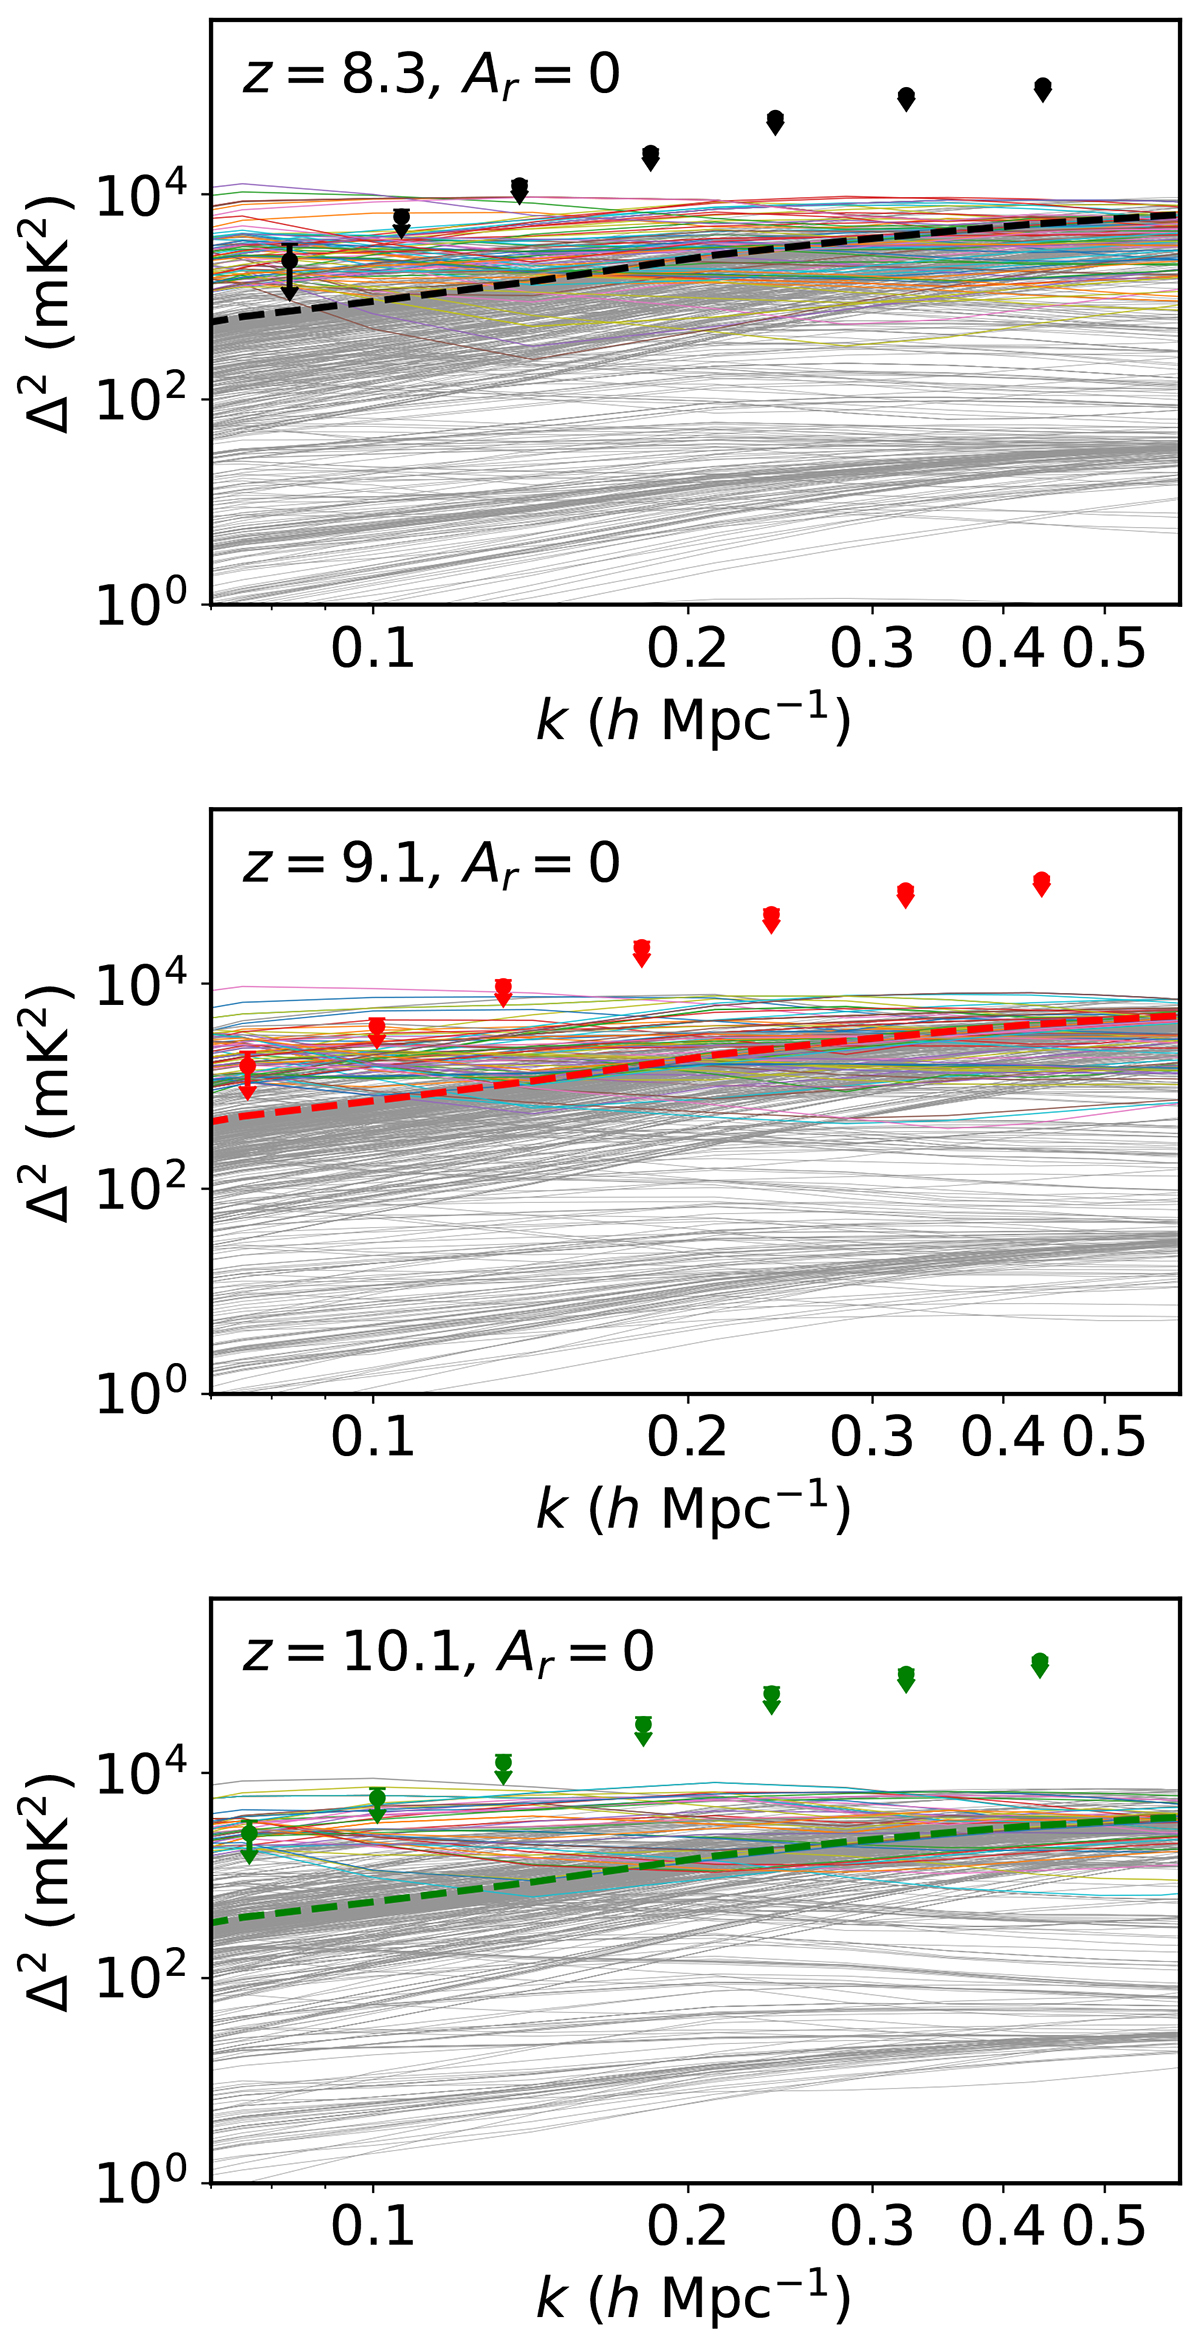
Set of 1000 power spectra randomly chosen from the 105 simulated power spectra. Panels from top to bottom refer to z = 8.3, 9.1, and 10.1, respectively. These correspond to the scenario with no additional radio background other than the CMB (Ar = 0). The down arrow points refer to the recent LOFAR 1σ upper limit (Δ212(k, z)±Δ21, err2(k, z)) from Mertens et al. (2025). As a reference, the dashed line corresponds to the power spectrum for a completely neutral IGM with no X-ray heating, and with TS = TK. The coloured power spectra are those with a value larger than Δ212(k, z)−Δ21, err2(k, z) in at least one k-bin, i.e. they have a high probability of being ruled out, while those in grey have a low exclusion probability.
Current usage metrics show cumulative count of Article Views (full-text article views including HTML views, PDF and ePub downloads, according to the available data) and Abstracts Views on Vision4Press platform.
Data correspond to usage on the plateform after 2015. The current usage metrics is available 48-96 hours after online publication and is updated daily on week days.
Initial download of the metrics may take a while.