Fig. I.1.
Download original image
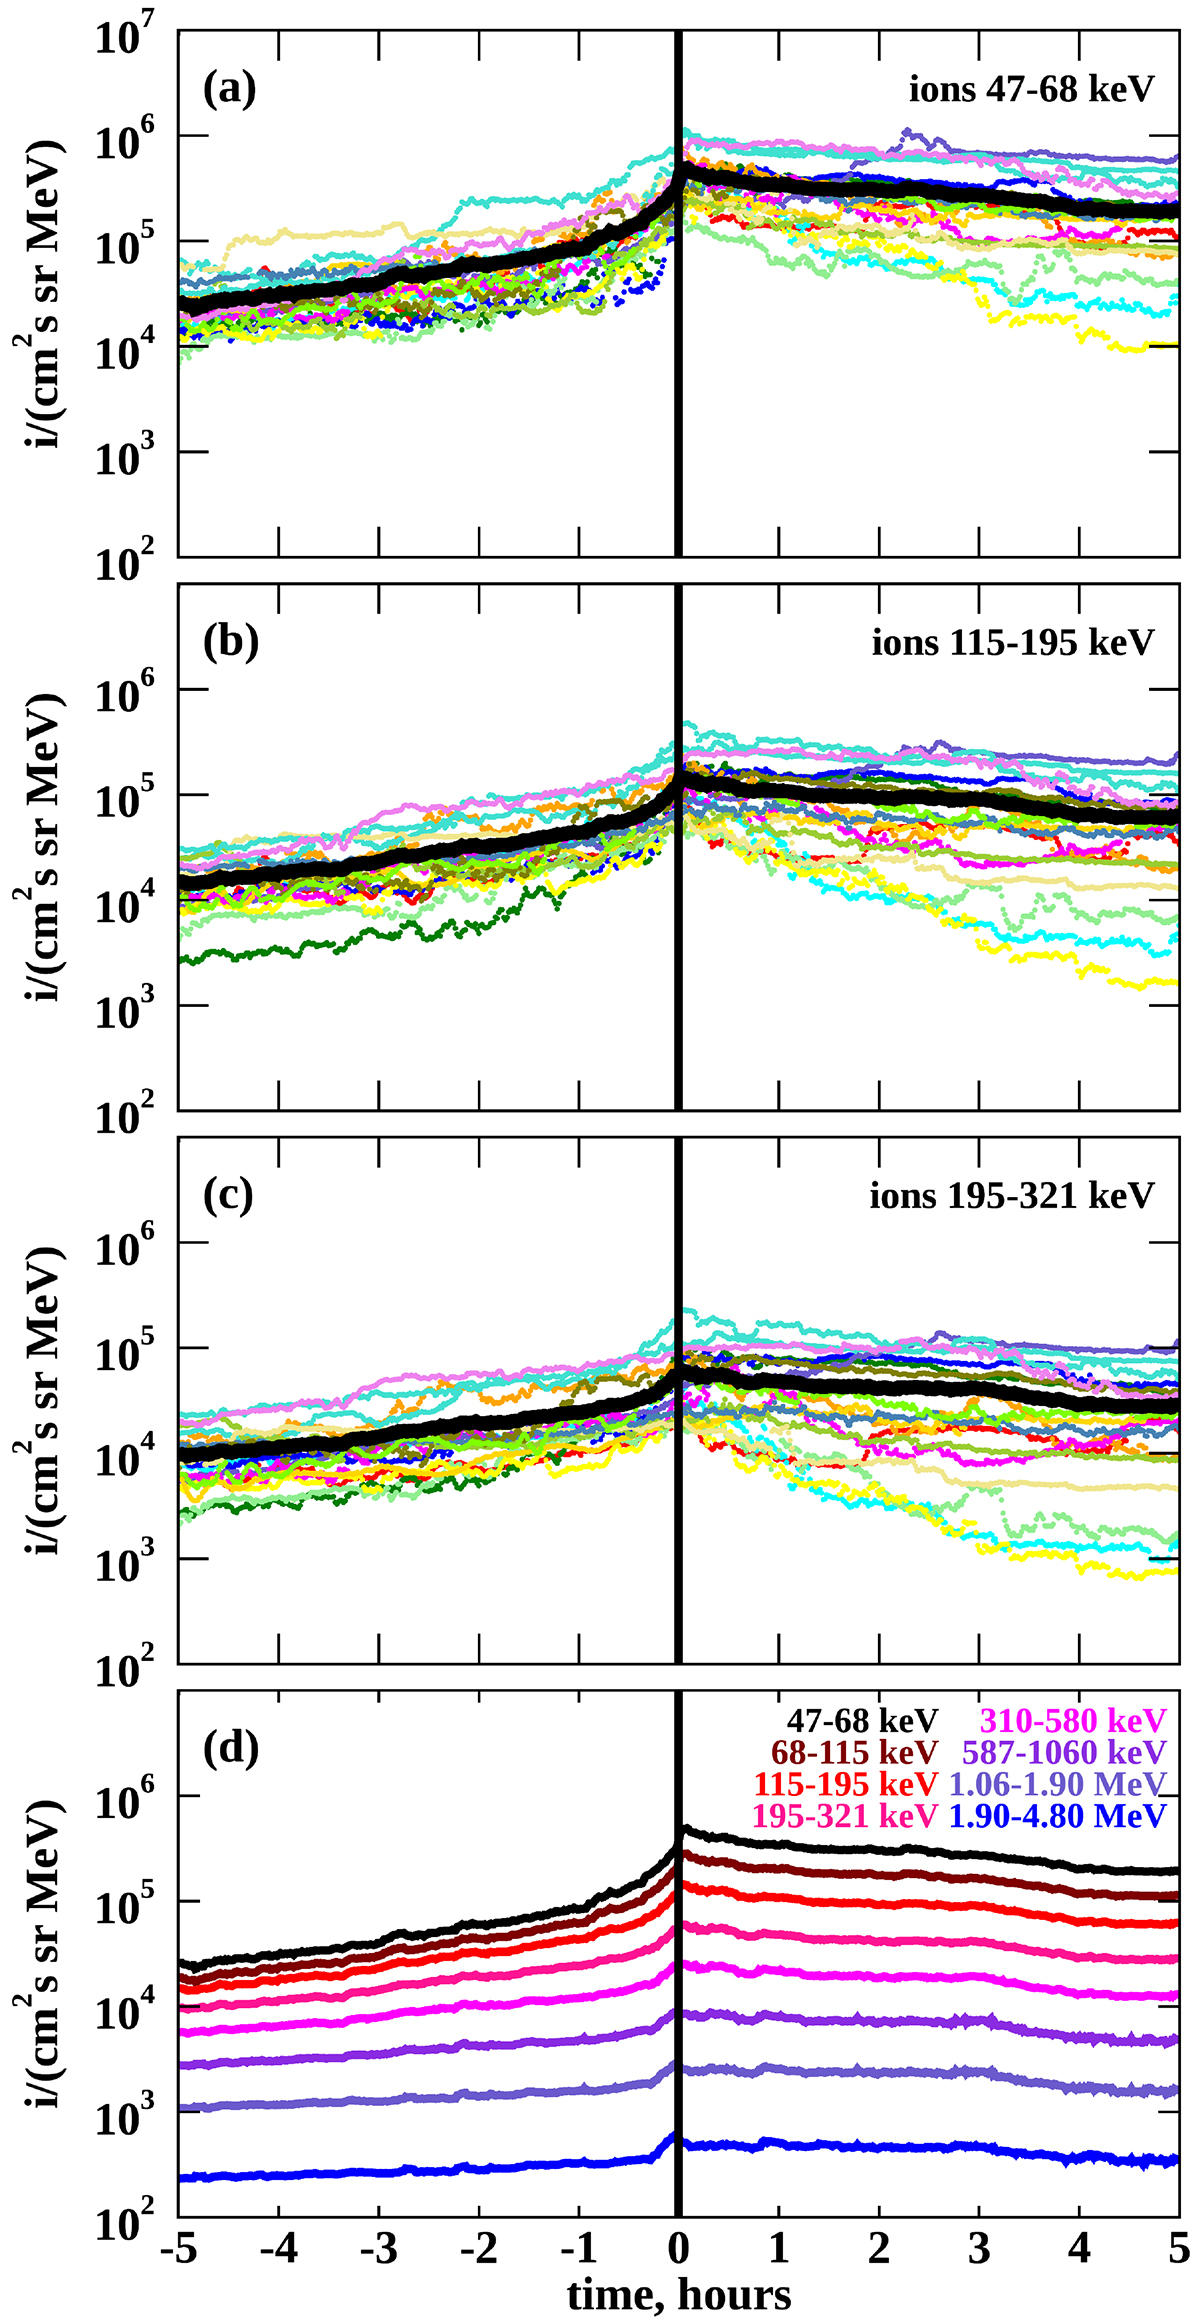
Superposed epoch analysis for the ESP events analysed by Lario et al. (2003) showing a plateau response. The different coloured curves in panels (a-c) show the ion intensities at three different energies as measured by ACE/EPAM/LEMS120 for the 18 ESP events classified as classic-ESP events by Lario et al. (2003) that showed an increase in the 1.9-4.8 MeV ion intensities. The thick black curves represent the mean intensities. The different curves in panel (d) show the average intensity for these 18 events at the different energy channels of ACE/EPAM/LEMS120. The vertical black line identifies the shock passage.
Current usage metrics show cumulative count of Article Views (full-text article views including HTML views, PDF and ePub downloads, according to the available data) and Abstracts Views on Vision4Press platform.
Data correspond to usage on the plateform after 2015. The current usage metrics is available 48-96 hours after online publication and is updated daily on week days.
Initial download of the metrics may take a while.