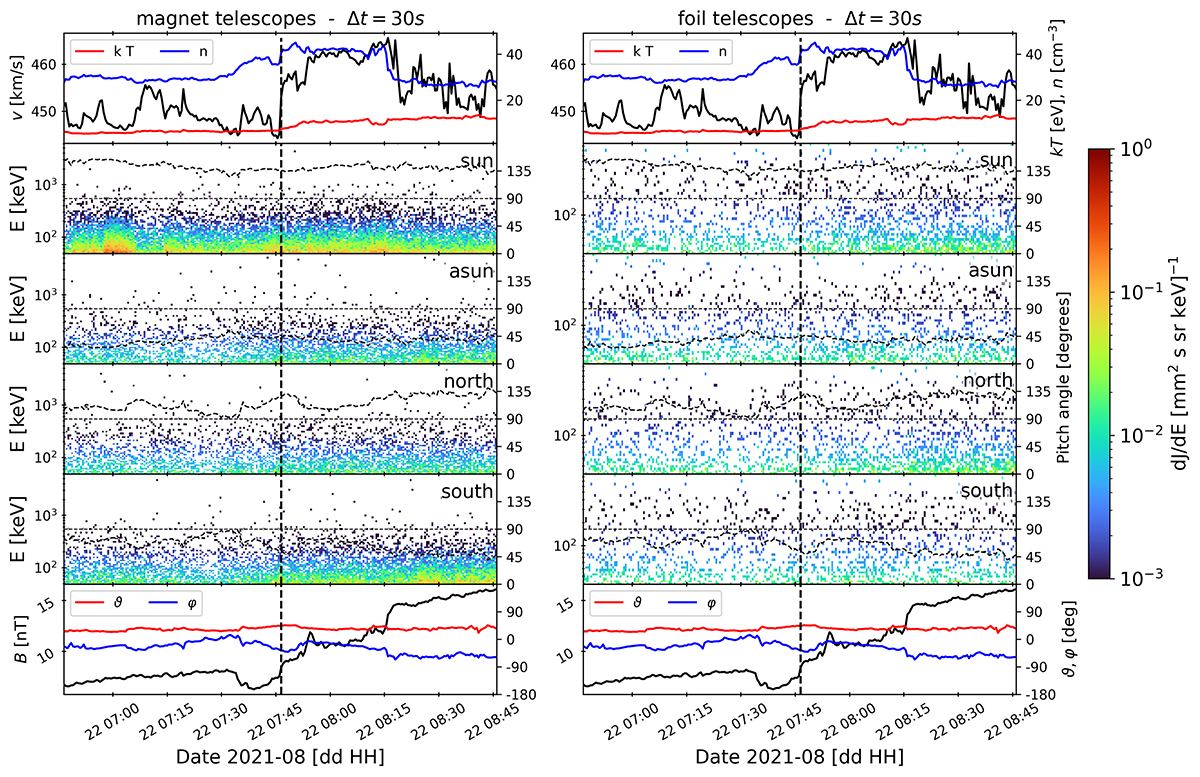
Fig. 2.
Download original image
Particle response to the IP shock on 22 August 2021. Top panel: Solar wind speed (black curve, left axis), solar wind temperature (red curve, right axis, kT), solar wind number density (blue curve, right axis). Middle four panels: EPT foil (left) and magnet (right) observations by Solar Orbiter from different telescopes, as indicated in the upper right corner of each panel. The pitch angle is shown as a dot-dashed line (right axis). The colour bar on the right shows the intensity. Bottom panel: Magnetic field magnitude ∣B∣ (black curve, left axis), and polar (red curve, right axis) and azimuthal (blue curve, right axis) angles. The vertical dashed line indicates the IP shock arrival.
Current usage metrics show cumulative count of Article Views (full-text article views including HTML views, PDF and ePub downloads, according to the available data) and Abstracts Views on Vision4Press platform.
Data correspond to usage on the plateform after 2015. The current usage metrics is available 48-96 hours after online publication and is updated daily on week days.
Initial download of the metrics may take a while.