Fig. 7
Download original image
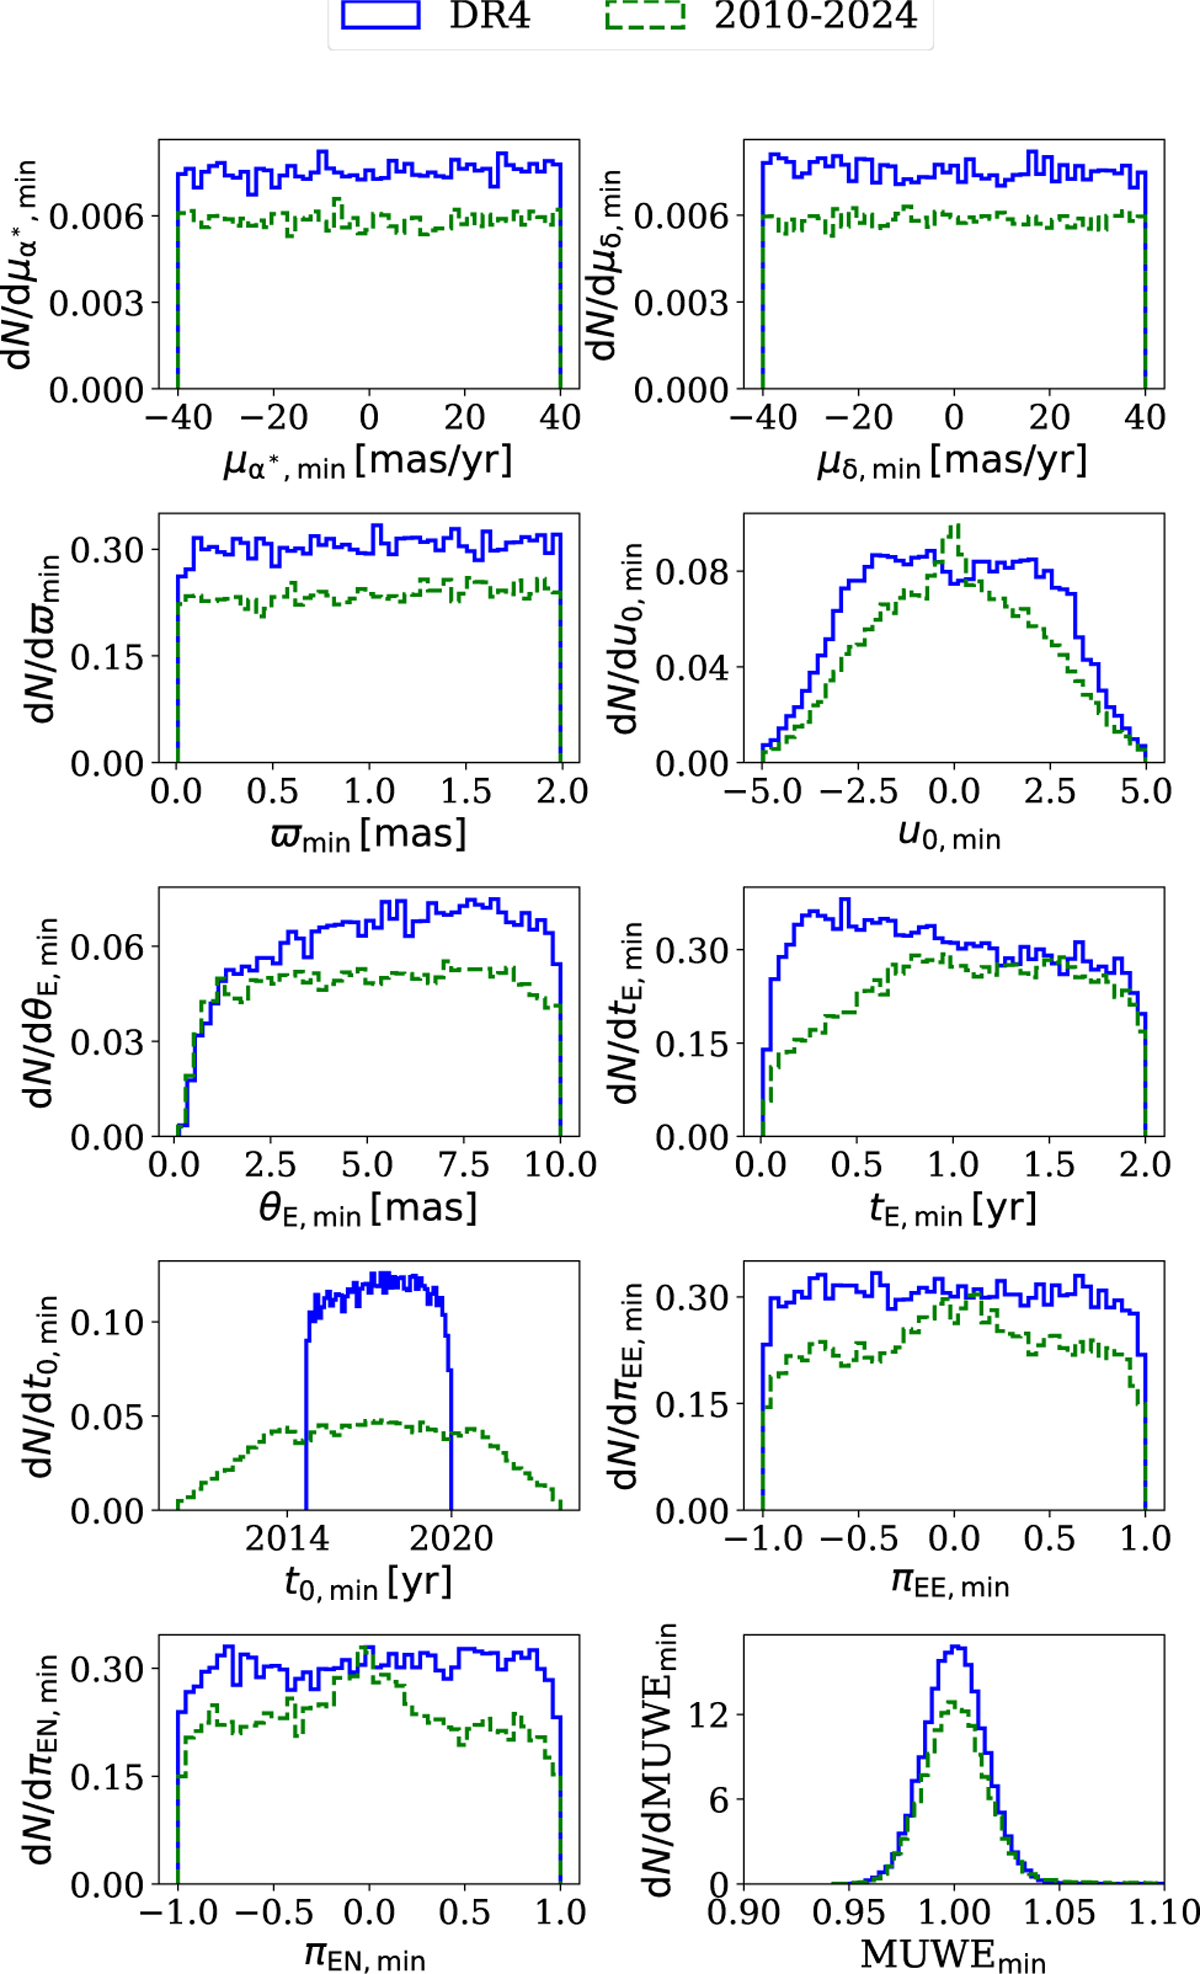
Distributions of parameter values after minimisation for recovered events for mock datasets lens_G14_N281_DR4 and lens_G14_N209_extended, corresponding to t0 ∈ [2014.5, 2020] yr and t0 ∈ [2010, 2024] yr, respectively. The values in individual bins denote the number of recovered events within the corresponding bin range. The integral of distributions is normalised to Prec (see Table 3).
Current usage metrics show cumulative count of Article Views (full-text article views including HTML views, PDF and ePub downloads, according to the available data) and Abstracts Views on Vision4Press platform.
Data correspond to usage on the plateform after 2015. The current usage metrics is available 48-96 hours after online publication and is updated daily on week days.
Initial download of the metrics may take a while.