| Issue |
A&A
Volume 666, October 2022
|
|
|---|---|---|
| Article Number | L16 | |
| Number of page(s) | 5 | |
| Section | Letters to the Editor | |
| DOI | https://doi.org/10.1051/0004-6361/202244656 | |
| Published online | 24 October 2022 | |
Letter to the Editor
A possible nearby microlensing stellar remnant hiding in Gaia DR3 astrometry
1
Astronomical Observatory, University of Warsaw, Al. Ujazdowskie 4, 00-478 Warszawa, Poland
e-mail: This email address is being protected from spambots. You need JavaScript enabled to view it.
2
Department of Particle Physics and Astrophysics, Weizmann Institute of Science, Rehovot 76100, Israel
3
Institute of Astronomy, University of Cambridge, Madingley Road, CB3 0HA Cambridge, UK
Received:
1
August
2022
Accepted:
22
September
2022
Abstract
Massive galactic lenses with large Einstein Radii should cause a measurable astrometric microlensing effect, that is, a light centroid shift due to the motion of the two images. Such a shift in the position of a background star due to microlensing was not included in the Gaia astrometric model, and therefore significant deviation should cause Gaia’s astrometric parameters to be determined incorrectly. Here we study one of the photometric microlensing events reported in the Gaia Data Release 3, GaiaDR3-ULENS-001, for which a poor goodness of Gaia fit and erroneous parallax could indicate the presence of an astrometric microlensing signal. Based on the photometric microlensing model, we simulated Gaia astrometric time series with the astrometric microlensing effect added. We find that including microlensing with an angular Einstein radius of θE = 2.60−0.24+0.21 mas (2.47−0.24+0.28 mas) assuming a positive (negative) impact parameter, u0, reproduces the astrometric quantities reported by Gaia well. We estimate the mass of the lens to be 1.00−0.18+0.23 M⊙ (0.70−0.13+0.17 M⊙) and its distance 0.90−0.11+0.14 kpc (0.69−0.09+0.13 kpc), proposing the lens could be a nearby isolated white dwarf.
Key words: astrometry / gravitational lensing: micro
© M. Jabłońska et al. 2022
 Open Access article, published by EDP Sciences, under the terms of the Creative Commons Attribution License (https://creativecommons.org/licenses/by/4.0), which permits unrestricted use, distribution, and reproduction in any medium, provided the original work is properly cited.
This article is published in open access under the Subscribe-to-Open model. This email address is being protected from spambots. You need JavaScript enabled to view it. to support open access publication.
1. Introduction
Gaia Data Release 3 (DR3) contained 1.806 billion sources down to G ∼ 21 mag, with 1.46 billion sources with full astrometric solutions (Gaia Collaboration 2021, 2022). The model fit to those sources had five or six parameters: position (two parameters), proper motions in right ascension and declination (two parameters), and parallax, and, in fainter cases, the sixth parameter – pseudocolour – is added (Lindegren et al. 2021). Such a model describes an isolated source with linear motion on the sky perturbed by Gaia’s orbital motion around the Sun. Any additional motion (e.g. due to unresolved binarity) was not included in the standard model, and therefore sources with more complex motion will not match the model well (Lindegren et al. 2012, 2021; Belokurov et al. 2020; Penoyre et al. 2020). The Gaia DR3 catalogue contains a number of statistics on the goodness of the astrometric fit to the individual sources, for example parallax_over_error, χ2, astrometric excess noise, or astrometric excess noise significance. Lindegren (2018) introduced the renormalized unit weight error (RUWE), the empirically re-normalized unit weight error (UWE), which is the square root of the reduced χ2. The re-normalization takes the brightness and colour of the source into account. Lindegren (2018) strongly advised using the RUWE instead of the UWE or other astrometric model quality measures derived in Gaia data releases in order to identify sources with astrometry that does not match the five- or six-parameter model. For example, in the works of Penoyre et al. (2020) and Belokurov et al. (2020) it is shown that the RUWE statistic can be used to identify unresolved binary stars in the Gaia Data Release 2 dataset as the photo-centre wobble causes additional residuals in the basic astrometric five-parameter model. There have also recently been other applications of astrometric statistics to identify astrometric centroid deviations (e.g. Bouma et al. 2020; Gomel et al. 2021; Gandhi et al. 2022).
Astrometric microlensing can be another cause of an additional apparent motion in the sources hiding in the Gaia DR3 data. This effect (Høg 1995; Miyamoto & Yoshii 1995; Walker 1995; Dominik & Sahu 2000) is caused by the appearance of two lensed images of the source (in the case of a single lens) and their evolution in position and brightness while the source and the lens change their relative position projected on the sky. Since the separation between the images in the case of Galactic microlensing is of the order of milliarcseconds, the images are typically not resolvable. However, the centre of light shifts during the event, and the amplitude of the shift is comparable to the separation between the images. Gaia has long been predicted to be able to detect such anomalies (Belokurov & Evans 2002; Rybicki et al. 2018; Klüter et al. 2020) as the mission is expected to have enough accuracy to detect subtle changes in position at the sub-milliarcsecond level. Detection of astrometric microlensing leads to a direct measurement of the angular Einstein radius (θE), which is necessary to measure the mass and distance of the lens from the equations
 (1)
(1)
where κ = 4G/(c2 au)=8.144 mas/M⊙, DS is the distance to the source in kpc, and πE is the unit-less microlensing parallax, caused by the non-linear motion of the observer along the Earth’s orbital plane around the Sun. The effect of microlensing parallax often causes subtle deviations and asymmetries in the light curves of events that last a few months or more, so Gaia’s orbital motion cannot be neglected (Gould 2000).
The Gaia team is expected to publish all the individual astrometric, photometric, and spectroscopic data points for all sources in their fourth data release1. In Gaia DR3, the only astrometric information for sources with no non-single-star solution is embedded in the five- or six-parameter model of linear proper motion and parallax. In this work we search for potential signatures of astrometric microlensing in the Gaia DR3 astrometric statistics for microlensing events reported by Gaia itself in the first catalogue of microlensing events (Wyrzykowski et al. 2022). We identify the best candidate event, which is bright enough to have a detectable astrometric microlensing signal and is located away from the Bulge, where other factors could affect Gaia’s astrometry. We investigate the possibility that astrometric deviations reported by Gaia are caused by astrometric microlensing. Based on simulations of Gaia astrometric data in combination with Gaia’s photometry, we estimate the angular size of the Einstein radius, θE, to be in the range inferred from the two solutions,  mas (positive u0) and
  mas (negative u0), and conclude that the lens could be a
  (
( ) isolated object, most likely a main sequence or a white dwarf (WD) star, at a distance of
  kpc (
kpc ( kpc) from the Sun.
2. Selection
Wyrzykowski et al. (2022) identified 363 microlensing events in Gaia DR3 data covering the years 2014−2017 located all over the sky. The vast majority, naturally, were located within the Galactic Plane, in particular towards the Galactic Bulge. From that sample, we selected events with baseline magnitudes brighter than G < 16 mag in the GaiaG band. This selection was motivated by the study of Rybicki et al. (2018), who simulated Gaia astrometric microlensing events and estimated the brightness limit at which Gaia’s astrometric accuracy is sufficient to detect astrometric microlensing signals.
In the selection process, we removed events located towards and close to the Galactic Bulge, within 20 deg in Galactic longitude. Despite having the highest sky-density of events, the Gaia astrometric data in that part of the sky are likely to suffer from multiple errors, often unaccounted for in the Gaia data processing, caused by crowding and source confusion (Gaia Collaboration 2021; Babusiaux et al. 2022; Lindegren et al. 2021).
We used the RUWE parameter as an indicator of potential microlensing signals in the Gaia astrometric data and limited our sample to sources with RUWE > 2 (Lindegren 2018). In our selection process, we also decided to choose bright microlensing events from DR3 with G0 < 16 mag. There was only one event that satisfies this and the aforementioned criteria, GaiaDR3-ULENS-001 = 6059400613544951552.
3. Microlensing model and mass estimate in the GaiaDR3-ULENS-001 event
GaiaDR3-ULENS-001 (RA = 184.4362°, Dec = −59.0294°) is a microlensing event that reached its maximum brightness at G = 12.783 mag in 2015 but went unnoticed by then ongoing microlensing surveys (Wyrzykowski et al. 2022). It is located at Galactic coordinates (298.6005°, 3.5587°), which is in the Crux constellation in the Southern Hemisphere.
Photometric data of GaiaDR3-ULENS-001 in the G, GBP, and GRPGaia bands were obtained from the Gaia DR3 data archive. The data were fit with standard and parallax microlensing models using MulensModel open source software (Poleski & Yee 2019). The parallax model included space-parallax due to the fact that the Gaia spacecraft is located in the L2 point of the Sun-Earth system, at 1.5 million km from Earth. However, the space-parallax signal was practically not detectable in the Gaia data. Figure 1 shows the photometric data with the best models found. The Markov chain Monte Carlo (MCMC) algorithm implemented in the emcee package (Foreman-Mackey et al. 2013) identified two solutions in the annual parallax model due to classical degeneracy in the impact parameter and parallax vector (the lens can pass the source on two sides). Their parameters are listed in Table 1. Both solutions indicate there is little light coming from objects other than the source.
 |
Fig. 1. GaiaDR3-ULENS-001 event light curve with the best parallax models for both solutions (solid dark lines) and the standard model without the parallax (dashed magenta line). The two parallax solutions overlap and are indistinguishable on this plot. |
Two solutions found for the photometric model of GaiaDR3-ULENS-001 with microlensing parallax (πEN, πEE) and blending (fS, source to total flux ratio in the GaiaG band). t0 is the moment of the minimal lens-source distance at u0 (in Einstein radius units).
The values obtained for the photometric model of GaiaDR3-ULENS-001 were used to generate the simulated astrometric microlensing signal. We used the astromet2 Python package to generate the astrometric track, which was then also used to simulate the Gaia five-parameter fit (Penoyre et al. 2022). Information about the individual astrometric observation epochs is provided by the scanninglaw package (Boubert et al. 2021).
The photometric model provides all parameters for the astrometric model except the angular Einstein radius, θE, the source distance, ϖ, and source proper motion, μS. The direction of the relative proper motion between the lens and the source ( ) is also known from photometry, as it is parallel with the vector of the parallax, πE (Gould 2000).
The input parameters for the astrometric model are (ϖ, μα*, μδ, θE). The along-scan (AL) errors for the specific astrometric measurements used in Gaia DR3 are unknown, as the only available errors measured are the astrometric χ2 and the RUWE. Therefore, in order to simulate the errors to fit them to the five-parameter solution, we estimated them by using the mean error function of the measured magnitude adopted from Lindegren et al. (2021). However, the errors can still differ for every measurement, as the function provides just the mean. Instead of applying a random function to the errors, we decided on introducing the scaling parameter, σAL, by which the sum of simulated errors is multiplied. This approach results in the same behaviour for time series with different numbers of observations and modifies the sum of astrometric per-CCD errors in the along-scan direction, which is actually included in the final Gaia five-parameter fit. To constrain the error scale, we filtered the results not only by the RUWE, but also by σϖ, σμ, α*, and σμ, δ, since they are also dependent on the astrometric errors. In Fig. 2 we show the dependence of the θE parameter that satisfies the Gaia DR3 values on the mean astrometric per-CCD error bar that would be obtained for the baseline magnitude in the G band assuming some value of σAL from the function presented by Lindegren et al. (2021). Since the parameters σϖ, σμ, α*, and σμ, δ have very similar values for a given set of astrometric model input parameters and an almost linear correlation, on the plot they are treated as one parameter and denoted as σσ, X.
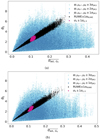 |
Fig. 2. Einstein radius (θE) used in the astrometric microlensing data simulation for GaiaDR3-ULENS-001, which reproduces the Gaia DR3 five-parameter astrometric fit to within their 3σ (grey circles), as a function of mean astrometric per-CCD error bar ( |

Gaia data contain 61 matched transits. Our simulator returns 65 matched transits. This is not alarming, as not all of the observations predicted based on the scanning law are published due to instrumental reasons, such as an unsatisfactory quality of measurements or lack of space for all the measurements in dense fields (Boubert et al. 2021). Using the published gaps for DR3, we determined that ten of the transits predicted by scanninglaw could be impacted by recorded events.
To fit the parameters to reproduce the actual Gaia DR3 five-parameter solution within its 3σ, we used the MCMC algorithm implemented in the NumPyro package (Bingham et al. 2019; Phan et al. 2019). To include the photometric model uncertainties, each sample was generated assuming random values from a normal distribution centred on the values presented in Table 2. We then constrained the results using the RUWE and the values of σϖ, σμ, α*, and σμ, δ. The photometric scatter caused the astrometric model to be non-deterministic in regards to the input parameters. The accepted range of RUWE and σX values were estimated by bootstrapping the astrometric model samples and resulted in σRUWE ≈ 0.12 and σσ, X ≈ 0.0018. We find that astrometric data with θE in the range 2.23 mas to 2.81 mas were fit with DR3 values within 3σ, RUWE within 1σRUWE, and parallax and proper motion uncertainties within 1σσ, X.
Values inferred from the astrometric models corresponding to the two solutions found for the photometric model of GaiaDR3-ULENS-001 and astrometric parameters of the lensed source after including the microlensing effect.
With the model that includes the microlensing signal, we also derived the source parameters, which differ from the ones in the five-parameter astrometric model without microlensing. The resulting values for the positive u0 solution are:  mas,
mas,  mas yr−1, and
  mas yr−1. For the negative u0 solution they are:
  mas,
mas,  mas yr−1, and
  mas yr−1.
Figure 3 shows the mass and distance values inferred from the simulated samples using Eq. (1) for both microlensing solutions. Combining the microlensing parallax value obtained from the DR3 photometry and the θE values that reproduce Gaia DR3 data, we estimated the mass of the lens to be in the range  (
( ) and its distance in the range
  kpc (
kpc ( kpc).
kpc).
 |
Fig. 3. Inferred lens mass versus lens distance for GaiaDR3-ULENS-001 for the positive u0 (top panel) and negative u0 (bottom panel) models. The lines indicate the 1σ bounds. |
The results of the astrometric track simulation for the positive u0 solution are shown in Fig. 4. These tracks were used to fit a mock Gaia five-parameter solution.
 |
Fig. 4. Simulated astrometric track for the GaiaDR3-ULENS-001 event. The solid blue line marks the source path without the microlensing effect. The thin, dashed black line marks the light centroid path. The coloured dots mark the light centroid positions during the measurement epochs per CCD. The thick, dashed black line shows the path corresponding to the five-parameter fit obtained by Gaia. The light grey lines represent randomly selected MCMC samples. The simulated track for the negative u0 solution is very close and was omitted for clarity. |
4. Discussion
We used the astrometric Gaia DR3 measurement for the GaiaDR3-ULENS-001 microlensing event to derive the size of its angular Einstein radius. If real, it would be the very first astrometric microlensing measurement using only Gaia observations. It relies on the assumption that the astrometric five-parameter Gaia model is a bad fit because of the microlensing effect distorting the source trajectory. At this stage, of course, we cannot rule out that the anomaly is just some kind of instrumental effect or even some astrophysical effect other than microlensing. On the other hand, the observation of an astrometric anomaly in a bright, isolated star that underwent a photometric microlensing event is very likely to be due to microlensing.
The nature of the lens3 can be inferred using a combination of the inferred mass, its distance, and the amount of light it emits, which can be estimated using a blending parameter from the microlensing photometric model. Although the blending median values in both solutions concentrated around 1.0 (i.e. 100% of lensed light comes from the source and the lens is dark), the distribution tails could correspond to some amount of light from the blend. In principle, the blend in dense stellar regions could also be a third light source, not associated with the event; however, here we explore the scenario that the blended light could be coming from the lens. We investigate if that light is enough for a very common type of lens in the Galaxy, namely a main sequence star.
To estimate the probability of this outcome, we used a simulation that uses the expected luminosity of a main sequence star at the inferred distance to estimate the probability of the considered lens being a main sequence star assuming the whole blended light is the lens’s light, following Wyrzykowski et al. (2016) and Mróz & Wyrzykowski (2021). Using the astrometric model in addition to the photometric model, the relative motion value, μrel, can be derived. The positive u0 solution yields a relative lens-source proper motion of  mas yr−1, and
  mas yr−1 for the negative u0 solution.
Since the exact value of the extinction to the lens is not known, all the results for the extinction between 0 mag and 2.35 mag were considered (Gaia Collaboration 2021). If there is no third light present, the chance of the lens being a dark lens depends greatly on the extinction. The extinction Galaxy model STILISM indicates that the reddening for 0.90 kpc (0.69 kpc) is 0.17 ± 0.07 mag (0.16 ± 0.05 mag). If real, the probability for the lens not being a main sequence star is over 89.58% (75.80%) for the positive (negative) u0 solution (Capitanio et al. 2017).
The 1σ ranges of the inferred lens masses for both solutions fit well under the Chandrasekhar limit. Therefore, a massive WD is the most likely possibility in the case of a dark lens.
The resulting mass was compared with the masses of WDs found using Gaia Early Data Release 3 (EDR3) by Gentile Fusillo et al. (2021). Figure 5 shows the distributions of masses of WDs with the assumptions of pure hydrogen and pure helium atmospheres. The negative u0 solution for a lens in the GaiaDR3-ULENS-001 event would match an average-mass WD, while the positive u0 solution would match a high-mass WD.
 |
Fig. 5. EDR3 WD mass distributions for mass distributions resulting for two models assuming pure hydrogen composition and pure helium composition. |
The high end of the mass distribution coincides with a few cases of known small neutron star masses (Lattimer & Prakash 2005; Özel & Freire 2016; Rawls et al. 2011). However, some theoretical models suggest the minimal mass to be around 1.17 M⊙ (Suwa et al. 2018). Therefore, it is less likely, although not impossible, that GaiaDR3-ULENS-001L is a low-mass neutron star.
Final conclusions on the nature of the lens should be possible in a couple of years when the lens and the source separate on the sky. Given the relative proximity of the lens, it should be possible to confirm or reject main sequence or WD scenarios.
5. Conclusions
We hope that the measurement of the astrometric effect of microlensing together with the photometric observations will let us unambiguously infer the parameters of lens mass, distance, and proper motions. The Gaia mission delivers astrometric measurements with milliarcsecond precision, which is enough to observe astrometric microlensing caused by stellar-mass lenses.
Gaia DR3 does not contain astrometric time series, just the five-parameter astrometric solution. Here we modelled the event GaiaDR3-ULENS-001 using its photometric Gaia light curve and reported the five-parameter Gaia DR3 astrometric solution together with its quality indicators under the assumption that the large RUWE value is the result of light centroid deviations caused by microlensing. We found two photometric models and two corresponding astrometric models, using the photometric values as input.
The inferred lens mass is  and
and  for the positive and negative solution, respectively. Since the blending value is close to 1.0, meaning the lens is probably a low-luminosity or dark object, a WD is the most likely explanation of the lens’s nature. In principle, given the sparsity of the Gaia light curve, we cannot fully rule out that the lens was a tight binary system and, in such a case, that the measured mass was the total mass of the system. Further detailed high-angular-resolution imaging taken years after the event is necessary to fully confirm the nature of the lens.
The methodology used here proved to be able to put much more specific constraints on the lens mass than what would be possible based on the photometry alone. Future Gaia data releases will also contain astrometric time series, which will provide more accurate mass measurements for hundreds of events.
Following a common convention, the lensing body in this microlensing event should be denoted as GaiaDR3-ULENS-001L.
Acknowledgments
We thank Drs. Ulrich Bastian, Berry Holl, Paweł Zieliński, Mariusz Gromadzki, Radek Poleski, Przemek Mróz, Andrzej Udalski and the OGLE team. This work has made use of data from the European Space Agency (ESA) mission Gaia (https://www.cosmos.esa.int/gaia), processed by the Gaia Data Processing and Analysis Consortium (DPAC, https://www.cosmos.esa.int/web/gaia/dpac/consortium). This work was supported from Polish NCN grants: Harmonia No. 2018/30/M/ST9/00311 and Daina No. 2017/27/L/ST9/03221. We acknowledge the European Commission’s H2020 grant ORP No. 101004719.
References
- Babusiaux, C., Fabricius, C., Khanna, S., et al. 2022, A&A, in press, https://doi.org/10.1051/0004-6361/202243790 [Google Scholar]
- Belokurov, V. A., & Evans, N. W. 2002, MNRAS, 331, 649 [NASA ADS] [CrossRef] [Google Scholar]
- Belokurov, V., Penoyre, Z., Oh, S., et al. 2020, MNRAS, 496, 1922 [Google Scholar]
- Bingham, E., Chen, J. P., Jankowiak, M., et al. 2019, J. Mach. Learn. Res., 20, 1 [Google Scholar]
- Boubert, D., Everall, A., Fraser, J., Gration, A., & Holl, B. 2021, MNRAS, 501, 2954 [NASA ADS] [CrossRef] [Google Scholar]
- Bouma, L. G., Winn, J. N., Ricker, G. R., et al. 2020, AJ, 160, 86 [NASA ADS] [CrossRef] [Google Scholar]
- Capitanio, L., Lallement, R., Vergely, J. L., Elyajouri, M., & Monreal-Ibero, A. 2017, A&A, 606, A65 [NASA ADS] [CrossRef] [EDP Sciences] [Google Scholar]
- Dominik, M., & Sahu, K. C. 2000, ApJ, 534, 213 [CrossRef] [Google Scholar]
- Foreman-Mackey, D., Hogg, D. W., Lang, D., & Goodman, J. 2013, PASP, 125, 306 [Google Scholar]
- Gaia Collaboration (Brown, A. G. A., et al.) 2021, A&A, 650, C3 [EDP Sciences] [Google Scholar]
- Gaia Collaboration (Vallenari, A., et al.) 2022, A&A, in press, https://doi.org/10.1051/0004-6361/202243940 [Google Scholar]
- Gandhi, P., Buckley, D. A. H., Charles, P., et al. 2022, MNRAS, 510, 3885 [CrossRef] [Google Scholar]
- Gentile Fusillo, N., Tremblay, P., Cukanovaite, E., et al. 2021, MNRAS, 508, 3877 [NASA ADS] [CrossRef] [Google Scholar]
- Gomel, R., Faigler, S., & Mazeh, T. 2021, MNRAS, 501, 2822 [CrossRef] [Google Scholar]
- Gould, A. 2000, ApJ, 542, 785 [NASA ADS] [CrossRef] [Google Scholar]
- Høg, E. 1995, in Future Possibilities for Astrometry in Space, eds. M. A. C. Perryman, & F. van Leeuwen, ESA Spec. Publ., 379, 125 [Google Scholar]
- Klüter, J., Bastian, U., & Wambsganss, J. 2020, A&A, 640, A83 [NASA ADS] [CrossRef] [EDP Sciences] [Google Scholar]
- Lattimer, J. M., & Prakash, M. 2005, Phys. Rev. Lett., 94, 111101 [NASA ADS] [CrossRef] [Google Scholar]
- Lindegren, L. 2018, Re-normalising the Astrometric Chi-square in Gaia DR2, GAIA-C3-TN-LU-LL-124, http://www.rssd.esa.int/doc_fetch.php?id=3757412 [Google Scholar]
- Lindegren, L., Lammers, U., Hobbs, D., et al. 2012, A&A, 538, A78 [NASA ADS] [CrossRef] [EDP Sciences] [Google Scholar]
- Lindegren, L., Klioner, S., Hernández, J., et al. 2021, A&A, 649, A2 [NASA ADS] [CrossRef] [EDP Sciences] [Google Scholar]
- Miyamoto, M., & Yoshii, Y. 1995, AJ, 110, 1427 [NASA ADS] [CrossRef] [Google Scholar]
- Mróz, P., & Wyrzykowski, Ł. 2021, Acta Astron., 71, 89 [Google Scholar]
- Özel, F., & Freire, P. 2016, ARA&A, 54, 401 [Google Scholar]
- Penoyre, Z., Belokurov, V., Wyn Evans, N., Everall, A., & Koposov, S. 2020, MNRAS, 495, 321 [NASA ADS] [CrossRef] [Google Scholar]
- Penoyre, Z., Belokurov, V., & Evans, N. W. 2022, MNRAS, 513, 2437 [NASA ADS] [CrossRef] [Google Scholar]
- Phan, D., Pradhan, N., & Jankowiak, M. 2019, ArXiv e-prints [arXiv:1912.11554] [Google Scholar]
- Poleski, R., & Yee, J. C. 2019, Astron. Comput., 26, 35 [NASA ADS] [CrossRef] [Google Scholar]
- Rawls, M. L., Orosz, J. A., McClintock, J. E., et al. 2011, ApJ, 730, 25 [NASA ADS] [CrossRef] [Google Scholar]
- Rybicki, K. A., Wyrzykowski, Ł., Klencki, J., et al. 2018, MNRAS, 476, 2013 [NASA ADS] [CrossRef] [Google Scholar]
- Suwa, Y., Yoshida, T., Shibata, M., Umeda, H., & Takahashi, K. 2018, MNRAS, 481, 3305 [NASA ADS] [CrossRef] [Google Scholar]
- Walker, M. A. 1995, ApJ, 453, 37 [NASA ADS] [CrossRef] [Google Scholar]
- Wyrzykowski, Ł., Kostrzewa-Rutkowska, Z., Skowron, J., et al. 2016, MNRAS, 458, 3012 [NASA ADS] [CrossRef] [Google Scholar]
- Wyrzykowski, Ł., Kruszyńska, K., Rybicki, K. A., et al. 2022, ArXiv e-prints [arXiv:2206.06121] [Google Scholar]
All Tables
Two solutions found for the photometric model of GaiaDR3-ULENS-001 with microlensing parallax (πEN, πEE) and blending (fS, source to total flux ratio in the GaiaG band). t0 is the moment of the minimal lens-source distance at u0 (in Einstein radius units).
Values inferred from the astrometric models corresponding to the two solutions found for the photometric model of GaiaDR3-ULENS-001 and astrometric parameters of the lensed source after including the microlensing effect.
All Figures
|
Fig. 1. GaiaDR3-ULENS-001 event light curve with the best parallax models for both solutions (solid dark lines) and the standard model without the parallax (dashed magenta line). The two parallax solutions overlap and are indistinguishable on this plot. |
| In the text | |
|
Fig. 2. Einstein radius (θE) used in the astrometric microlensing data simulation for GaiaDR3-ULENS-001, which reproduces the Gaia DR3 five-parameter astrometric fit to within their 3σ (grey circles), as a function of mean astrometric per-CCD error bar ( |
| In the text | |
|
Fig. 3. Inferred lens mass versus lens distance for GaiaDR3-ULENS-001 for the positive u0 (top panel) and negative u0 (bottom panel) models. The lines indicate the 1σ bounds. |
| In the text | |
|
Fig. 4. Simulated astrometric track for the GaiaDR3-ULENS-001 event. The solid blue line marks the source path without the microlensing effect. The thin, dashed black line marks the light centroid path. The coloured dots mark the light centroid positions during the measurement epochs per CCD. The thick, dashed black line shows the path corresponding to the five-parameter fit obtained by Gaia. The light grey lines represent randomly selected MCMC samples. The simulated track for the negative u0 solution is very close and was omitted for clarity. |
| In the text | |
|
Fig. 5. EDR3 WD mass distributions for mass distributions resulting for two models assuming pure hydrogen composition and pure helium composition. |
| In the text | |
Current usage metrics show cumulative count of Article Views (full-text article views including HTML views, PDF and ePub downloads, according to the available data) and Abstracts Views on Vision4Press platform.
Data correspond to usage on the plateform after 2015. The current usage metrics is available 48-96 hours after online publication and is updated daily on week days.
Initial download of the metrics may take a while.