Fig. 4.
Download original image
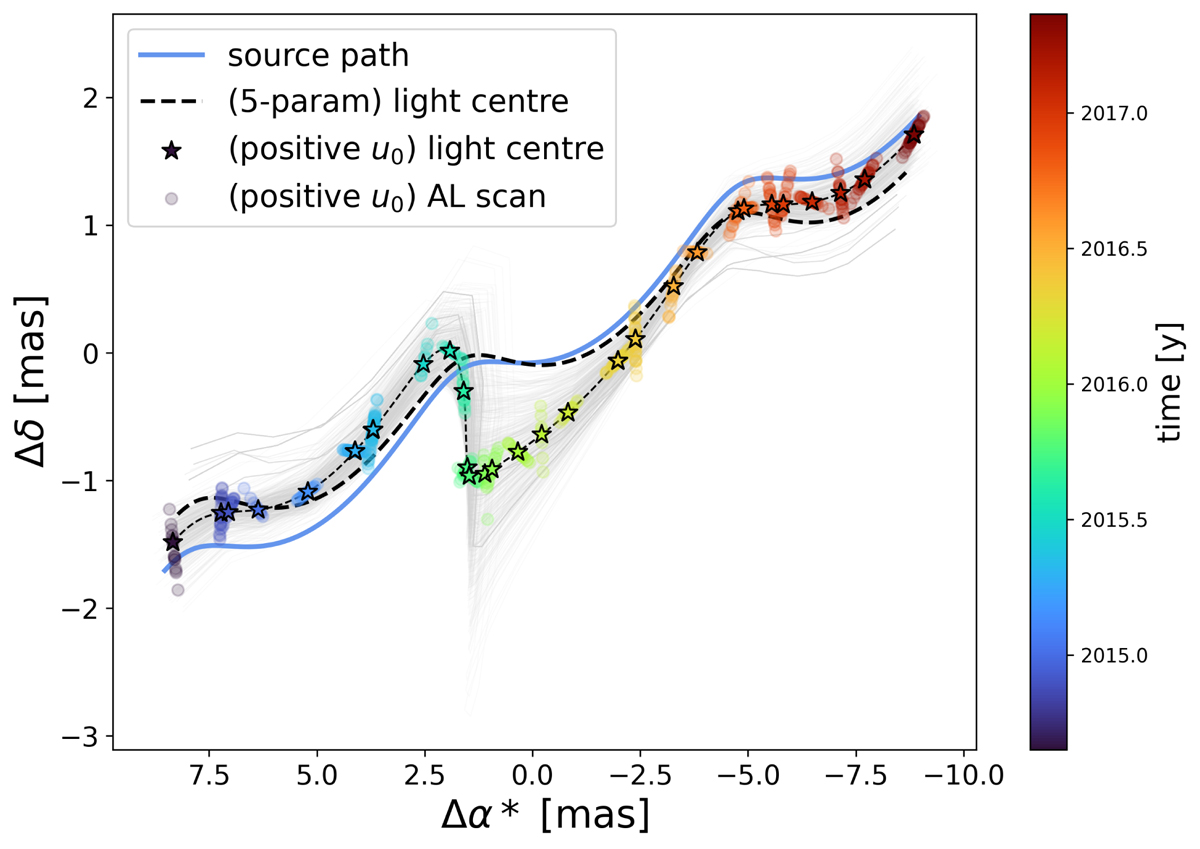
Simulated astrometric track for the GaiaDR3-ULENS-001 event. The solid blue line marks the source path without the microlensing effect. The thin, dashed black line marks the light centroid path. The coloured dots mark the light centroid positions during the measurement epochs per CCD. The thick, dashed black line shows the path corresponding to the five-parameter fit obtained by Gaia. The light grey lines represent randomly selected MCMC samples. The simulated track for the negative u0 solution is very close and was omitted for clarity.
Current usage metrics show cumulative count of Article Views (full-text article views including HTML views, PDF and ePub downloads, according to the available data) and Abstracts Views on Vision4Press platform.
Data correspond to usage on the plateform after 2015. The current usage metrics is available 48-96 hours after online publication and is updated daily on week days.
Initial download of the metrics may take a while.