Fig. A.1
Download original image
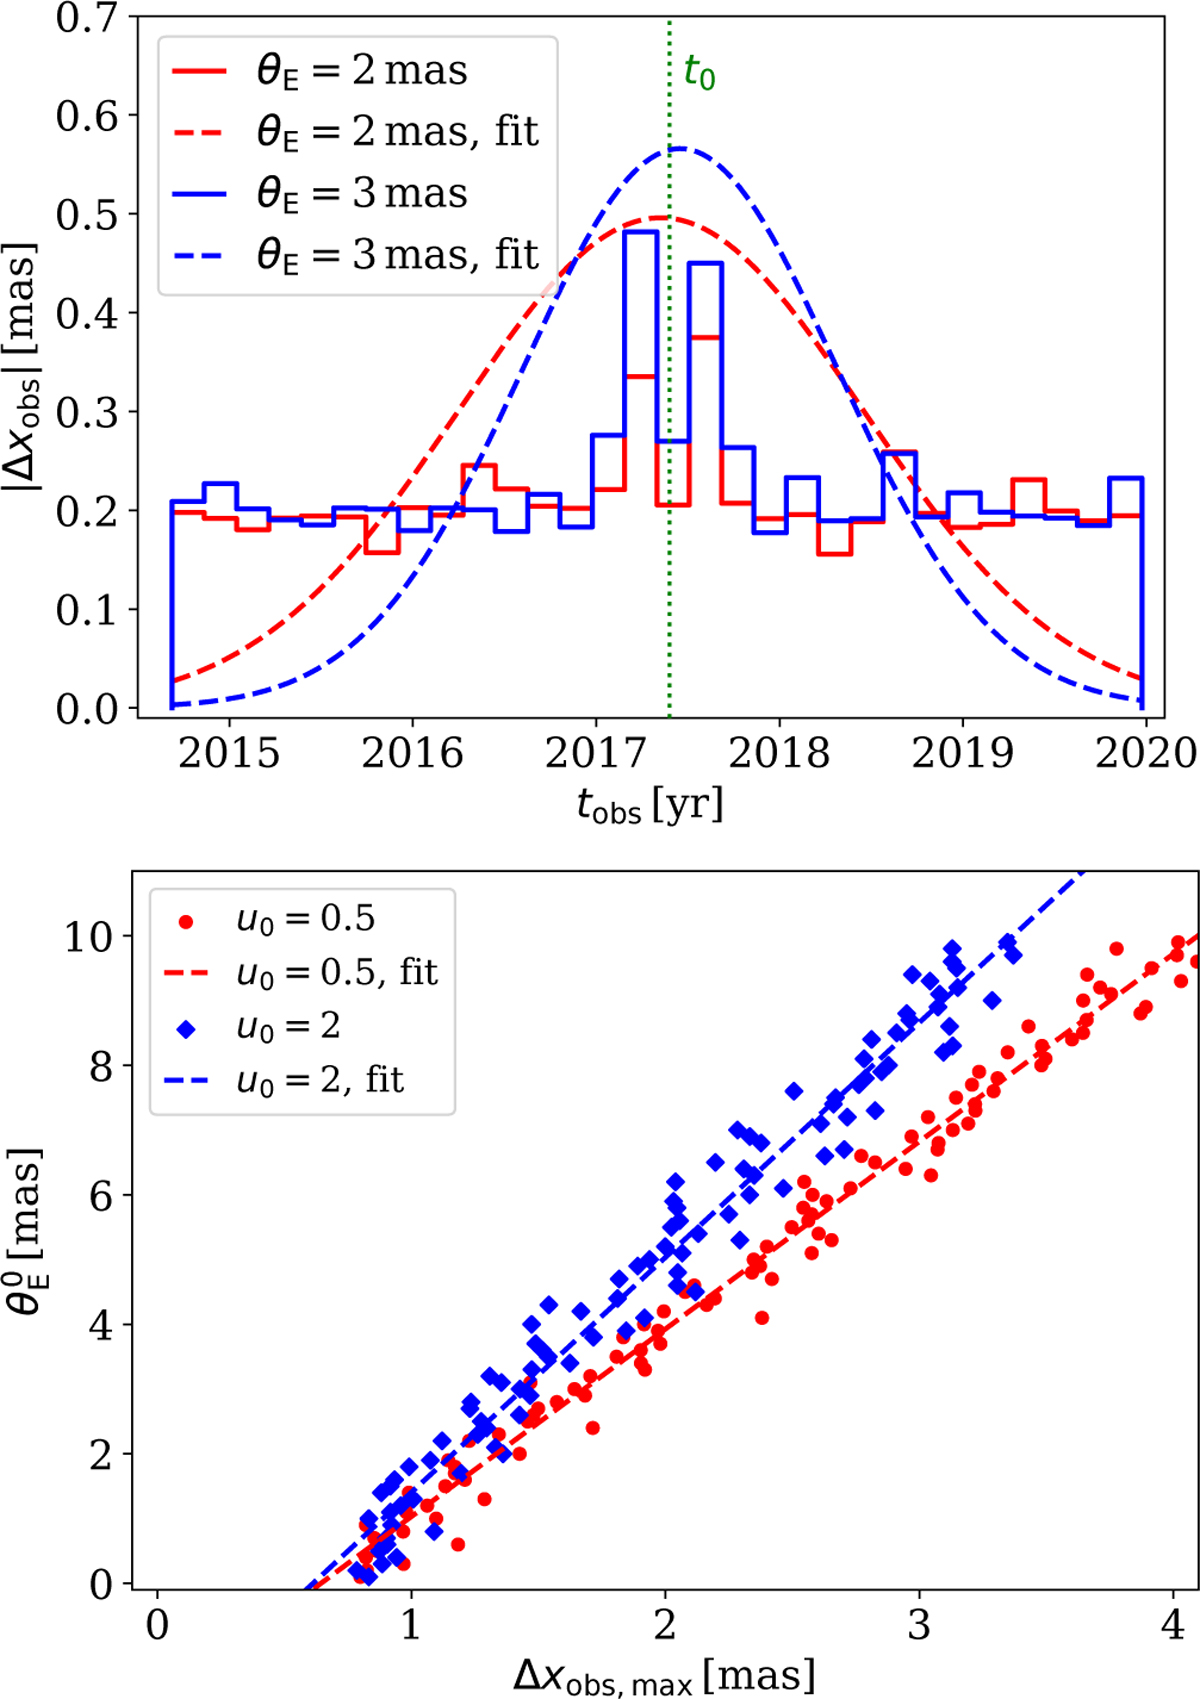
Upper panel: Residuals calculated as the absolute value of the mean of individual bins (solid lines) for θE = 1 mas (red) and θE = 3 mas (blue). We used 30 equally spaced bins in tobs. Histograms are normalised to 1. We assume ![]() (denoted by a vertical dotted green line), tE = 30 days, and πEE = πEN = 0.001. Residuals are fitted with a Gaussian (dashed lines). Lower panel:
(denoted by a vertical dotted green line), tE = 30 days, and πEE = πEN = 0.001. Residuals are fitted with a Gaussian (dashed lines). Lower panel: ![]() as a function of the maximum of residuals obtained from a Gaussian fit for u0 = 0.5 and (red circles) and u0 = 2 (blue diamonds). The dashed lines denote the best linear fit of the scatter plots.
as a function of the maximum of residuals obtained from a Gaussian fit for u0 = 0.5 and (red circles) and u0 = 2 (blue diamonds). The dashed lines denote the best linear fit of the scatter plots.
Current usage metrics show cumulative count of Article Views (full-text article views including HTML views, PDF and ePub downloads, according to the available data) and Abstracts Views on Vision4Press platform.
Data correspond to usage on the plateform after 2015. The current usage metrics is available 48-96 hours after online publication and is updated daily on week days.
Initial download of the metrics may take a while.