Fig. 1
Download original image
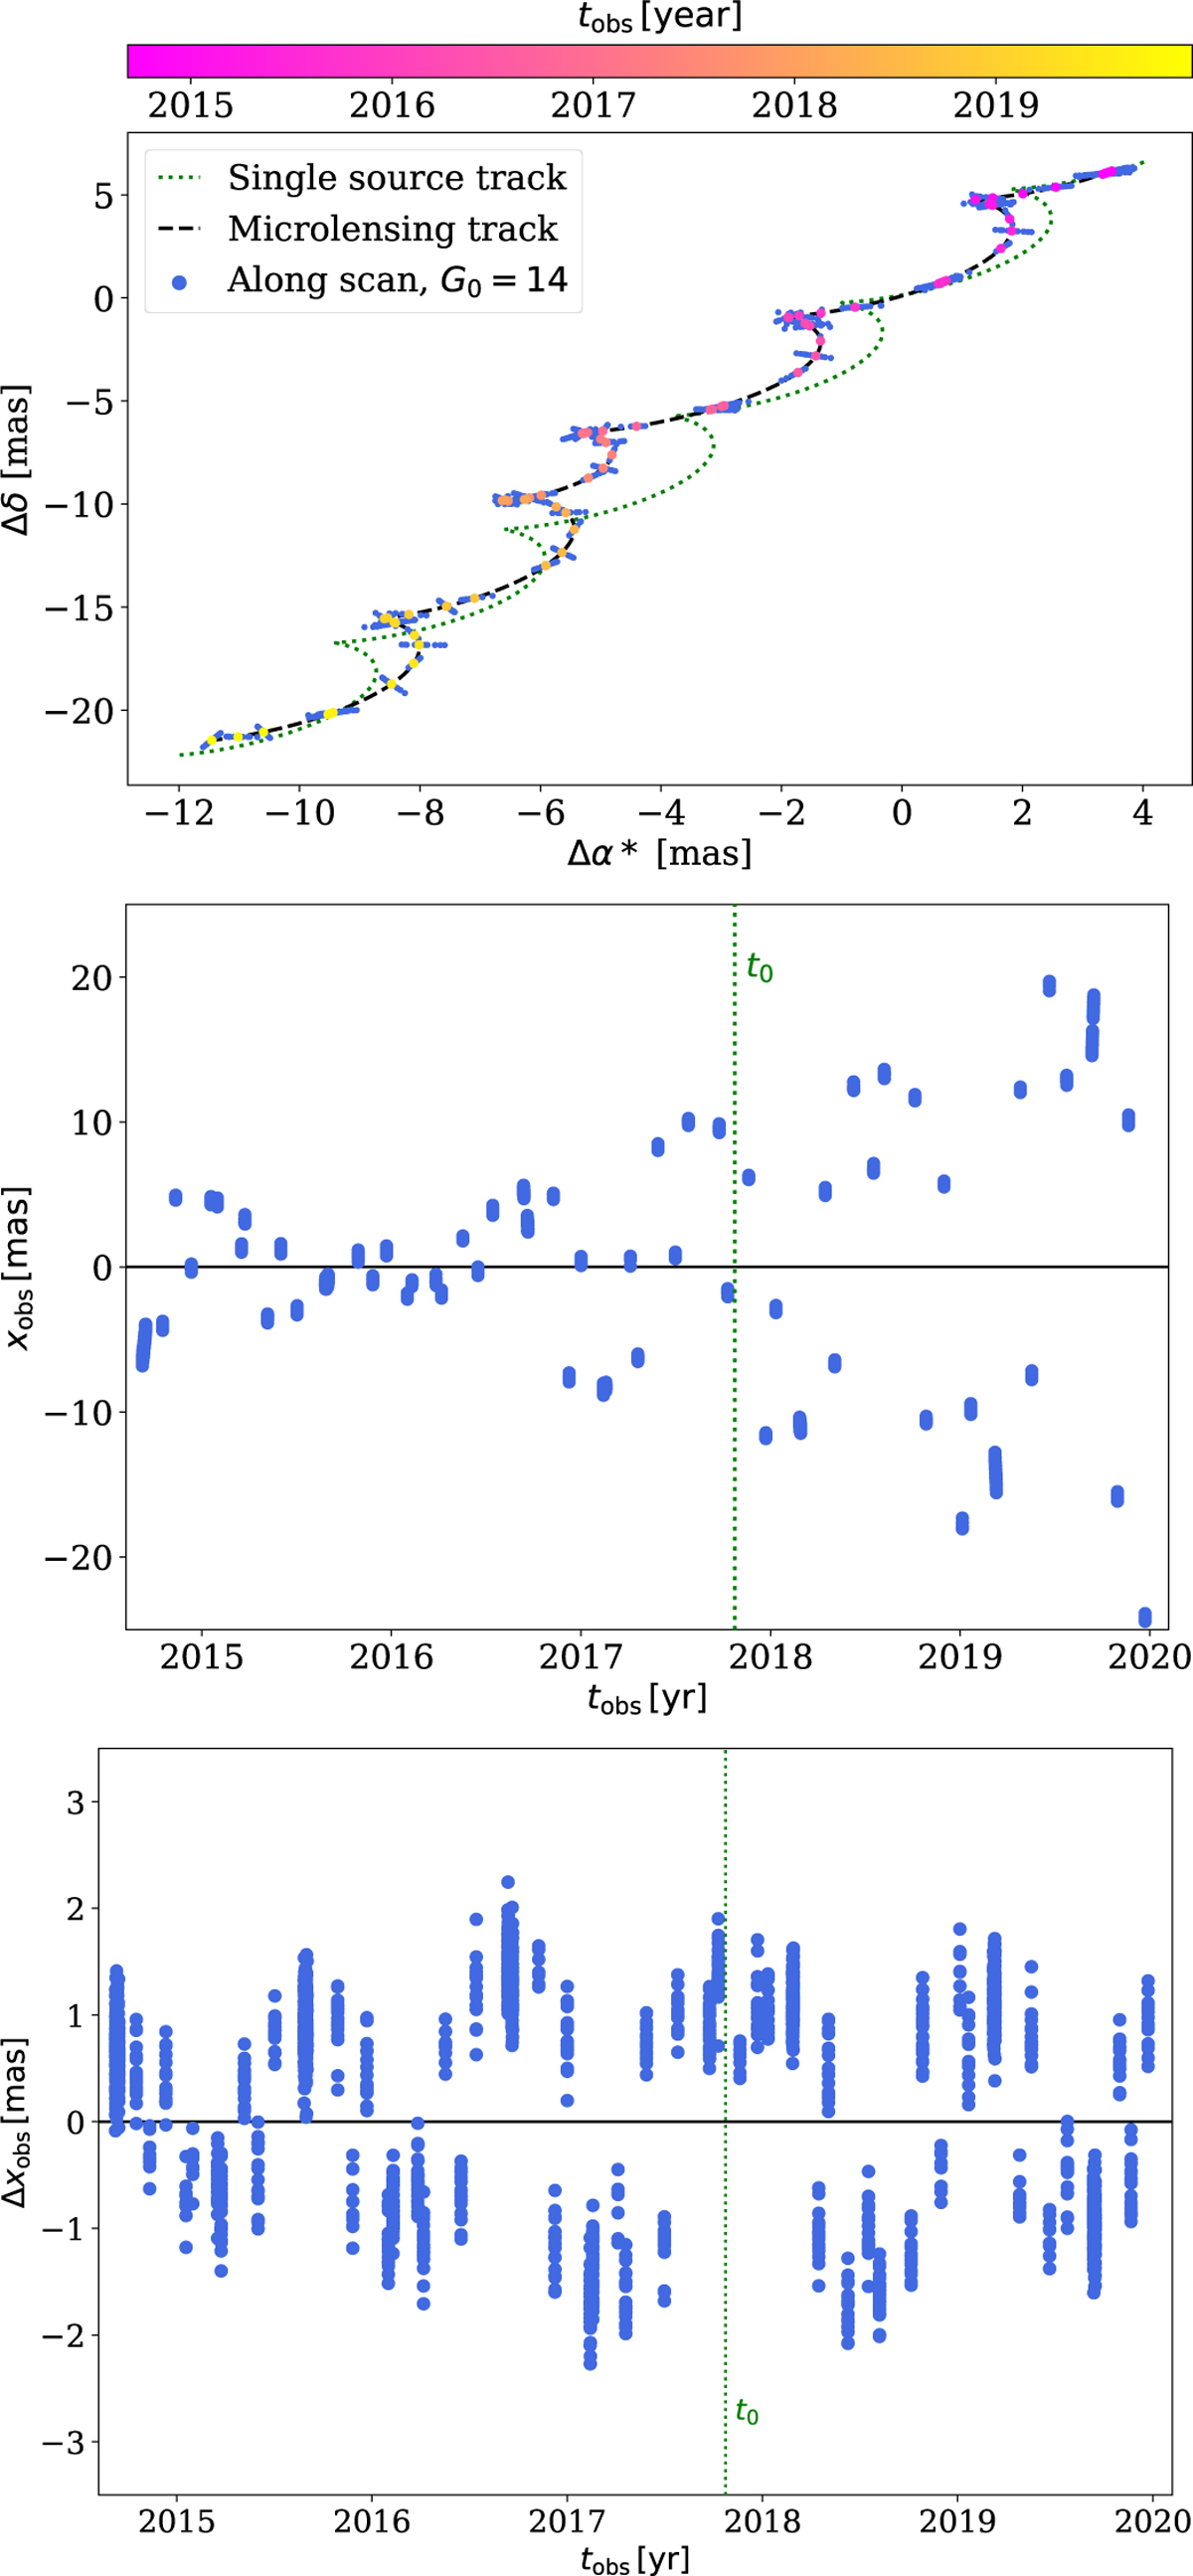
Upper panel: tracks of the light centroid for a single source event (dotted green line) and a microlensing event with the same single source parameters (dashed black line). The blue circles correspond to Gaia along-scan measurements at different tobs, denoted by the coloured circles. Middle panel: Gaia along-scan measurements, xobs, as a function of tobs for the microlensing event. Lower panel: residuals between the simulated data with microlensing vs the model with no microlensing (Δxobs) as a function of tobs. The vertical dashed green lines correspond to t0. For all the panels, we assume the following parameters: α0 = 6.5°, δ0 = −47.3°, μα* = −2.8 mas/yr, μδ = −5.5 mas/yr, ϖ = 1 mas, u0 = −0.6, θE = 5 mas, tE = 100 days, t0 = 2017.8, πEE = −0.1, πEN = −0.1, and G0 = 14.
Current usage metrics show cumulative count of Article Views (full-text article views including HTML views, PDF and ePub downloads, according to the available data) and Abstracts Views on Vision4Press platform.
Data correspond to usage on the plateform after 2015. The current usage metrics is available 48-96 hours after online publication and is updated daily on week days.
Initial download of the metrics may take a while.