Fig. C.3
Download original image
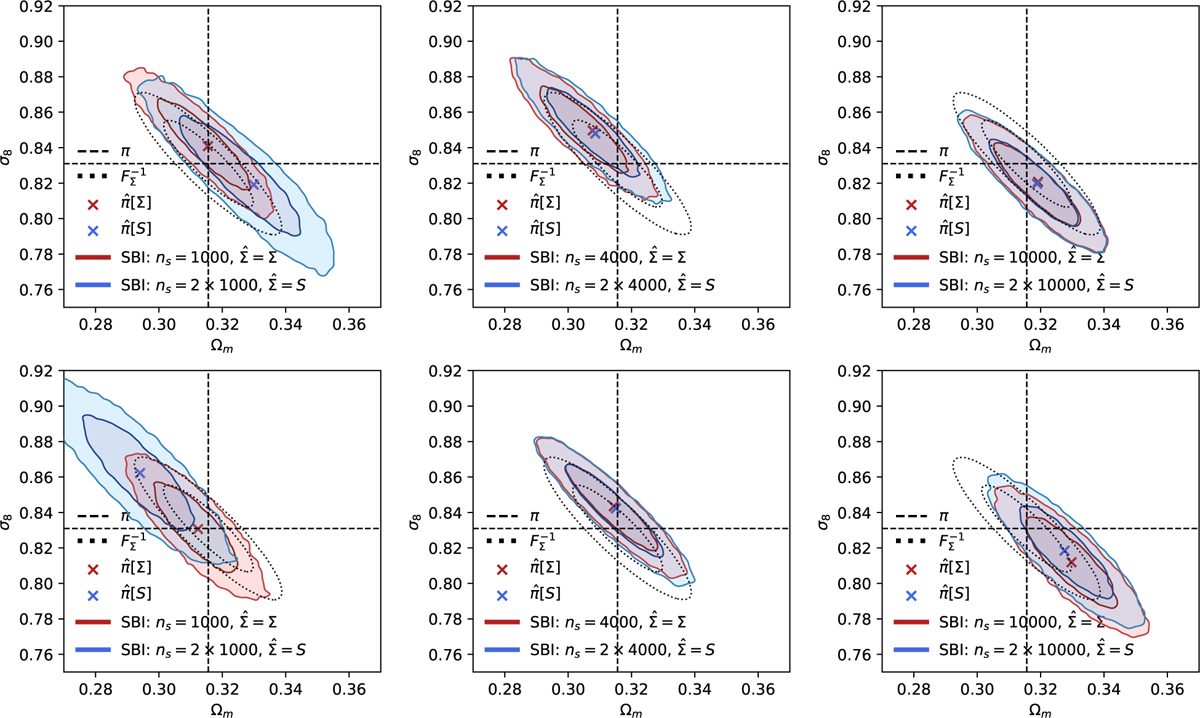
SBI posteriors (red for true covariance ![]() , blue for simulation-estimated covariance
, blue for simulation-estimated covariance ![]() , used in the compression of Eq. 12) derived with Neural Posterior fits from a set of repeated experiments for each value of the number of simulations ns using a CNF model (left) and a MAF model (right). Each panel is for a different random realization of data
, used in the compression of Eq. 12) derived with Neural Posterior fits from a set of repeated experiments for each value of the number of simulations ns using a CNF model (left) and a MAF model (right). Each panel is for a different random realization of data ![]() and covariance S, drawn from Gaussian and Wishart distributions, respectively. For each flow and value of ns, independent datavectors
and covariance S, drawn from Gaussian and Wishart distributions, respectively. For each flow and value of ns, independent datavectors ![]() linearly compressed to summaries
linearly compressed to summaries ![]() and are shown in red and blue. A Fisher forecast at true parameters π with the true data covariance Σ is shown with a dotted black line.
and are shown in red and blue. A Fisher forecast at true parameters π with the true data covariance Σ is shown with a dotted black line.
Current usage metrics show cumulative count of Article Views (full-text article views including HTML views, PDF and ePub downloads, according to the available data) and Abstracts Views on Vision4Press platform.
Data correspond to usage on the plateform after 2015. The current usage metrics is available 48-96 hours after online publication and is updated daily on week days.
Initial download of the metrics may take a while.