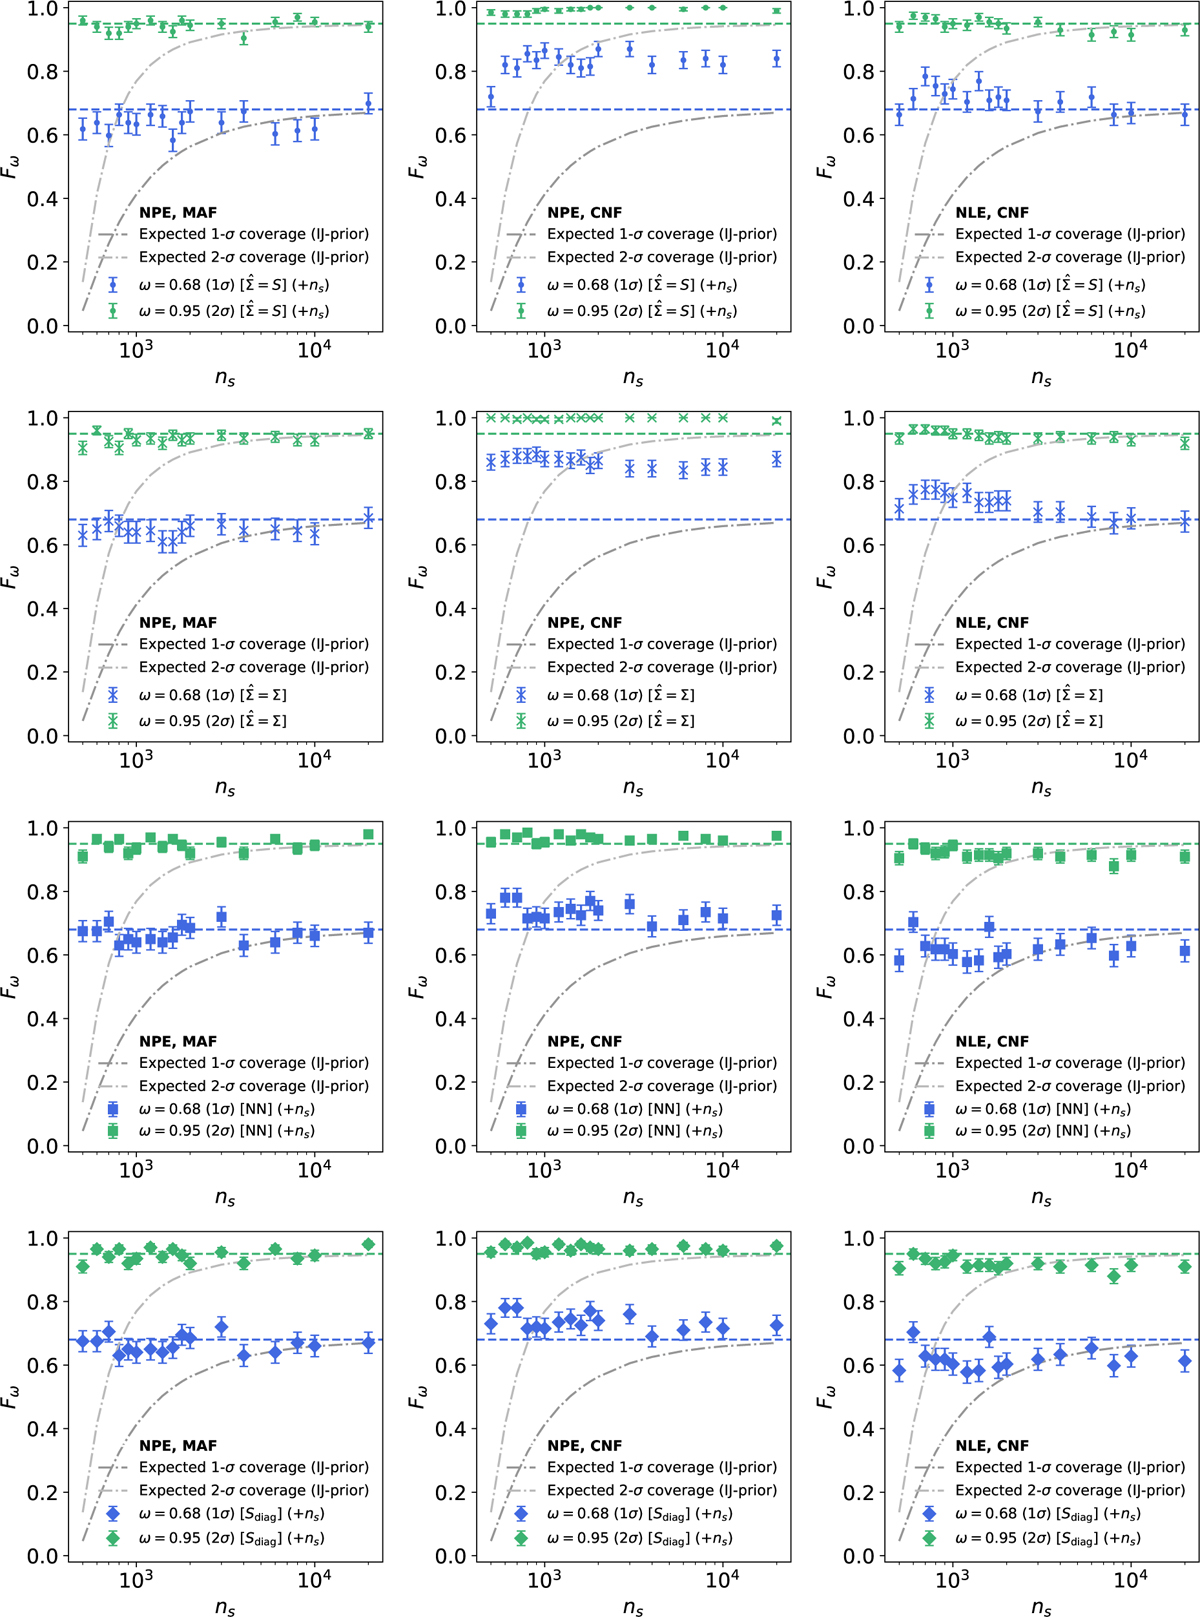
Fig. C.2
Download original image
Coverage Fω, i.e. how often the true cosmology in the experiment is found inside the 68 (1 − σ) and 95 (2 − σ)) credible regions of the estimated posterior (see Eq. 23) against the number of simulations ns used for the training set. Shown here are the results for Neural Posterior Estimation (separately with a MAF and CNF model) and Neural Likelihood Estimation (with a CNF model) for independently sampled data vectors and data covariance matrices in a series of repeated experiments with the number of simulations for each experiment on the horizontal axis. The expected coverage of a Gaussian posterior with a debiased estimate of the precision matrix (using the Hartlap correction, Eq. 3) and posterior covariance corrected with the Dodelson & Schneider (2013) factor is plotted for both coverage intervals with dashed lines. The grey-toned lines show the expected coverage of the common approach using a Gaussian posterior with a precision matrix corrected by applying the Hartlap factor. The additional simulations, not labelled on the x-axis, but required for the separate compressions (where the true covariance is unknown) are noted for each method. The SBI posteriors obtain the correct coverage to within errors for all numbers of simulations ns and each compression method.
Current usage metrics show cumulative count of Article Views (full-text article views including HTML views, PDF and ePub downloads, according to the available data) and Abstracts Views on Vision4Press platform.
Data correspond to usage on the plateform after 2015. The current usage metrics is available 48-96 hours after online publication and is updated daily on week days.
Initial download of the metrics may take a while.