Fig. 2
Download original image
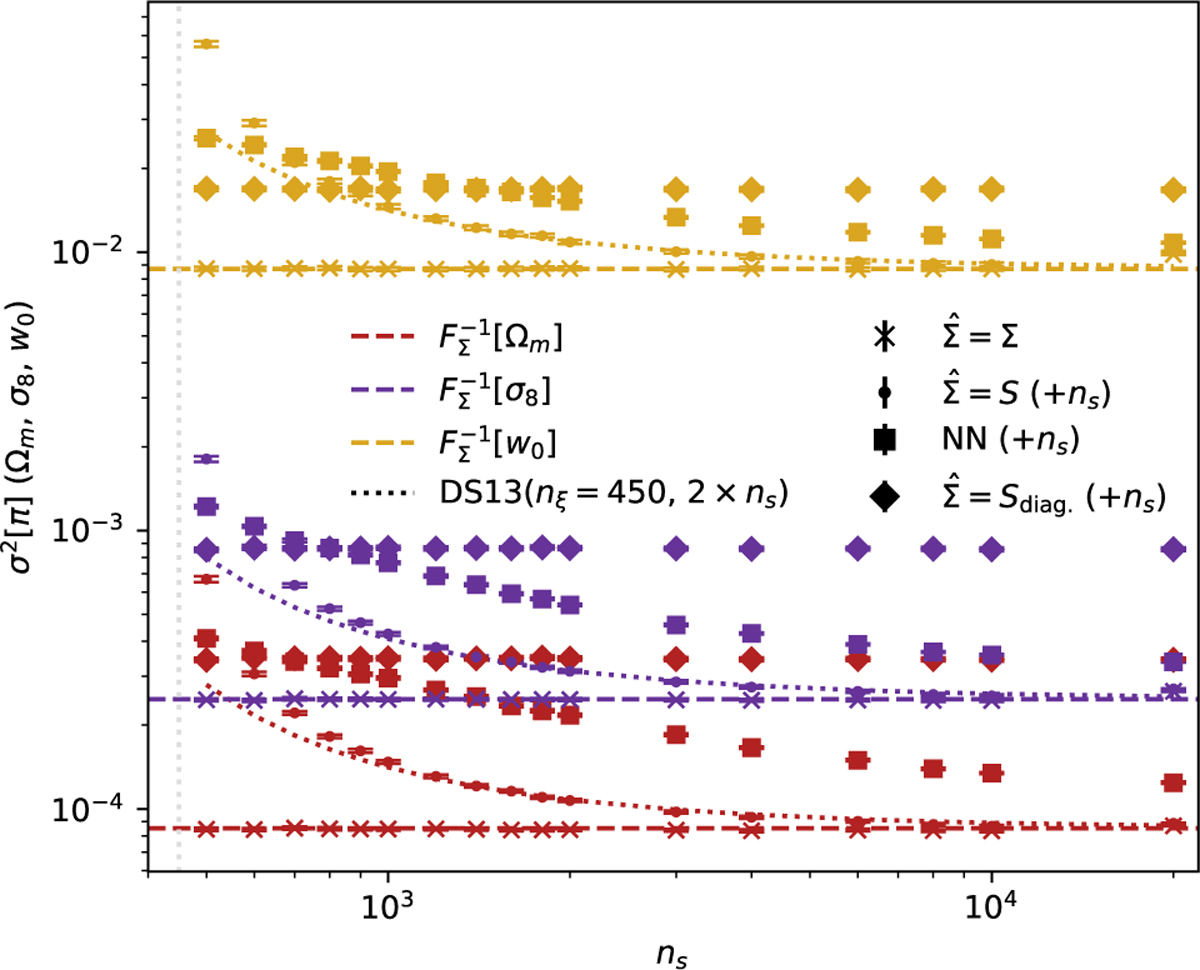
Average model parameter posterior variance reported by methods compared in this work, conditioned on noisy data vectors estimated with neural-likelihood estimation using a masked autoregressive flow. The colour-coded dashed lines show the (Fisher) variances that would have been measured if the exact data covariance had been known and used in a Gaussian likelihood ansatz with a flat prior. Cross points label posterior variances from SBI analyses where the exact data covariance was known for linear compression (Eq. (12)). Dotted lines show the expected variances of the maximum a posteriori that would have been measured when using a data covariance estimated from a set of ns simulations. Note that these lines multiply the Fisher variance with the factor (Eq. (7)) Dodelson & Schneider (2013) calculated using 2 × ns simulations. Circle points label posterior variances from SBI analyses where the data covariance was estimated from ns simulations and used in a linear compression. Diamond points label posterior variances obtained when using a compression with the diagonal elements of the estimated covariance matrix. Square points show variances obtained using a neural network for the compression, trained on ns simulations. All points include a 1-σ error bar on the variances estimated over all of the experiments. The additional simulations, not labelled on the x-axis but required for the separate compressions (where the true covariance is unknown), are noted for each method. When the true data covariance is not known, necessitating the use of double the number of simulations, the reconstructed posterior errors from SBI are significantly higher than the Dodelson & Schneider (2013) corrected errors when that correction is substantial.
Current usage metrics show cumulative count of Article Views (full-text article views including HTML views, PDF and ePub downloads, according to the available data) and Abstracts Views on Vision4Press platform.
Data correspond to usage on the plateform after 2015. The current usage metrics is available 48-96 hours after online publication and is updated daily on week days.
Initial download of the metrics may take a while.