Fig. 1
Download original image
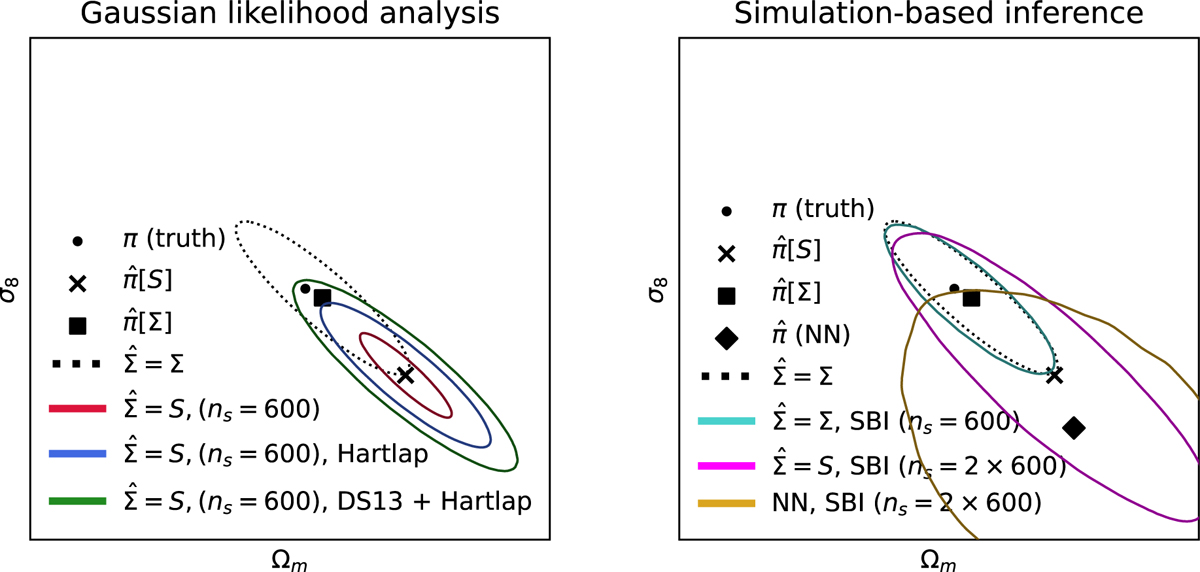
Effects of estimated data error distribution on posterior contours and their locations. We show estimates ![]() of parameters π and the estimated 1 − σ confidence contours. The dotted black contours show the posterior derived with the true covariance Σ from noiseless data. Left: results from Gaussian-likelihood analysis. In red, the posterior derived with the estimated covariance S from 600 simulations is shown. In blue, the posterior derived the same way, but with the inverse covariance corrected with the Hartlap factor (Anderson 2003; Hartlap et al. 2006), is given. Finally, in green, we show the same, but with the correction of Dodelson & Schneider (2013) applied to the inverted sample covariance as well, arguably the best result obtainable without additional knowledge of the data covariance. We ask, which of the contours in this diagram will SBI methods produce given a similarly limited number of simulations? Right: results of applying SBI with linear and neural-network-based compressions. In magenta, the contour returned from applying neural-likelihood estimation with 600 simulations compressed using a data covariance S estimated with 600 simulations is shown. In teal, we give the neural-likelihood estimation applied with 600 simulations compressed using the true data covariance Σ. In yellow, we show the contour obtained by applying a neural-likelihood estimation, with 600 simulations compressed using a neural network that was fitted with 600 simulations.
of parameters π and the estimated 1 − σ confidence contours. The dotted black contours show the posterior derived with the true covariance Σ from noiseless data. Left: results from Gaussian-likelihood analysis. In red, the posterior derived with the estimated covariance S from 600 simulations is shown. In blue, the posterior derived the same way, but with the inverse covariance corrected with the Hartlap factor (Anderson 2003; Hartlap et al. 2006), is given. Finally, in green, we show the same, but with the correction of Dodelson & Schneider (2013) applied to the inverted sample covariance as well, arguably the best result obtainable without additional knowledge of the data covariance. We ask, which of the contours in this diagram will SBI methods produce given a similarly limited number of simulations? Right: results of applying SBI with linear and neural-network-based compressions. In magenta, the contour returned from applying neural-likelihood estimation with 600 simulations compressed using a data covariance S estimated with 600 simulations is shown. In teal, we give the neural-likelihood estimation applied with 600 simulations compressed using the true data covariance Σ. In yellow, we show the contour obtained by applying a neural-likelihood estimation, with 600 simulations compressed using a neural network that was fitted with 600 simulations.
Current usage metrics show cumulative count of Article Views (full-text article views including HTML views, PDF and ePub downloads, according to the available data) and Abstracts Views on Vision4Press platform.
Data correspond to usage on the plateform after 2015. The current usage metrics is available 48-96 hours after online publication and is updated daily on week days.
Initial download of the metrics may take a while.