Fig. 23.
Download original image
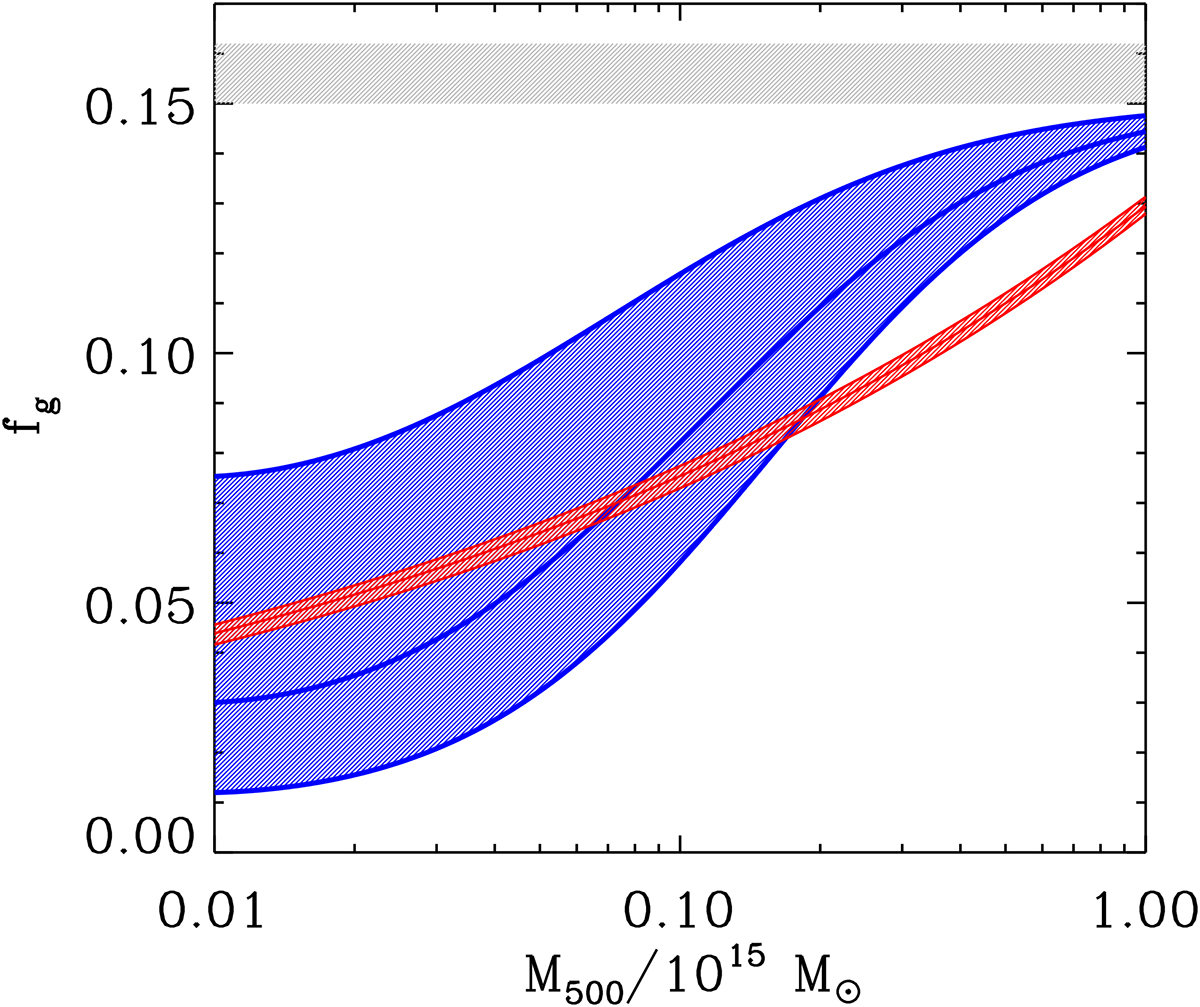
Gas fraction as a function of halo mass. The solid blue lines show the profiles for the three choices of parameters adopted to fit cluster and group thermodynamic profiles. The blue shaded region spans the region between the different profiles. The red shaded region shows the gas fraction derived in Ettori et al. (2023) to minimize scatter in cluster scaling relations. The gray shaded region shows the cosmic baryon fraction.
Current usage metrics show cumulative count of Article Views (full-text article views including HTML views, PDF and ePub downloads, according to the available data) and Abstracts Views on Vision4Press platform.
Data correspond to usage on the plateform after 2015. The current usage metrics is available 48-96 hours after online publication and is updated daily on week days.
Initial download of the metrics may take a while.