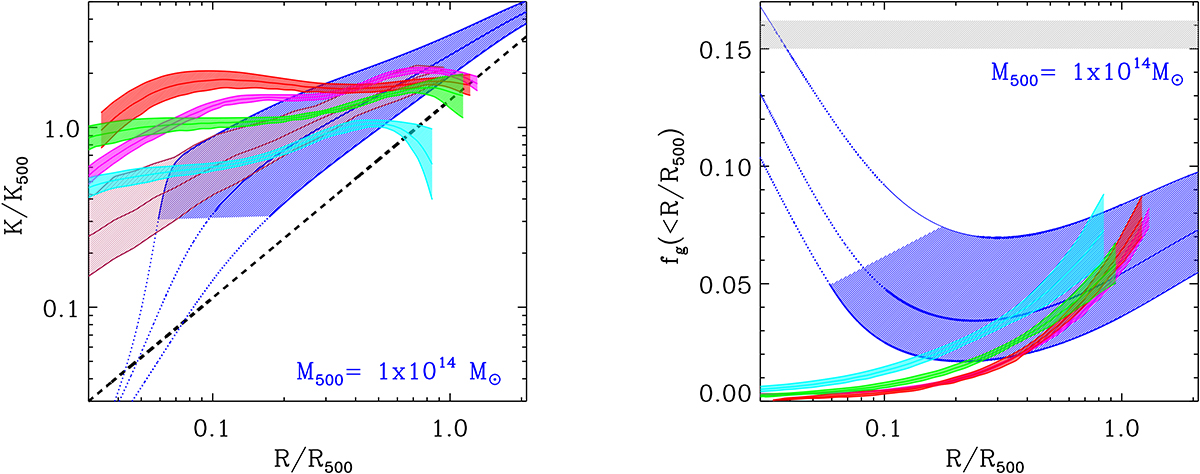
Fig. 21.
Download original image
Left panel: Radial entropy profiles. The blue and brown shaded regions respectively show the model for M500 = 1014 M⊙ and the Sun et al. (2009) profiles, already reported in Fig. 20. The red, green, violet, and cyan shaded regions represent profiles reported in Eckert et al. (2024). Right panel: Same as the left panel but for the gas fraction profiles. The gray shaded region shows the cosmic baryon fraction.
Current usage metrics show cumulative count of Article Views (full-text article views including HTML views, PDF and ePub downloads, according to the available data) and Abstracts Views on Vision4Press platform.
Data correspond to usage on the plateform after 2015. The current usage metrics is available 48-96 hours after online publication and is updated daily on week days.
Initial download of the metrics may take a while.