Fig. 19.
Download original image
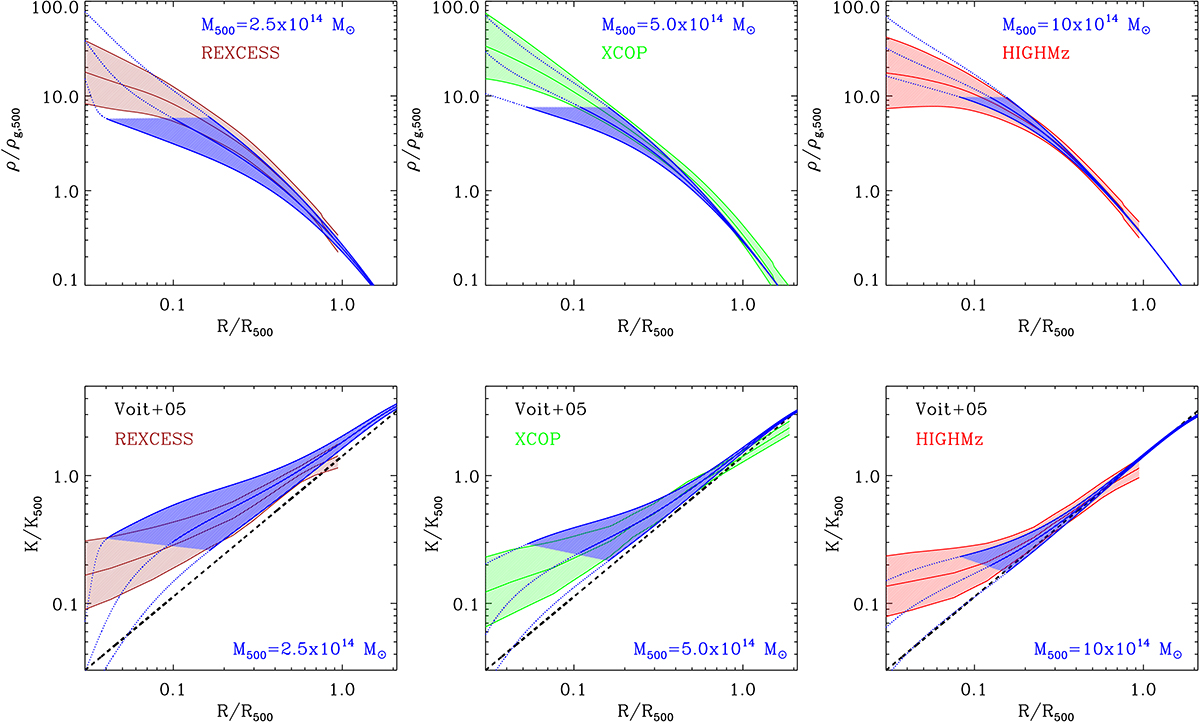
Top panels: Gas density profiles from the model presented in Sect. 5 with corrections described in Sects. 6.1.1 and 6.1.2 for M500 = 2.5 × 10¹⁴ M⊙ (left), M500 = 5.0 × 10¹⁴ M⊙ (center), and M500 = 1015 M⊙ (right) compared with observations from the REXCESS, XCOP, and HIGHMz samples respectively. For further details see the label of Fig. 18. Bottom panels: Same as top panels but for the entropy profiles.
Current usage metrics show cumulative count of Article Views (full-text article views including HTML views, PDF and ePub downloads, according to the available data) and Abstracts Views on Vision4Press platform.
Data correspond to usage on the plateform after 2015. The current usage metrics is available 48-96 hours after online publication and is updated daily on week days.
Initial download of the metrics may take a while.