Fig. 18.
Download original image
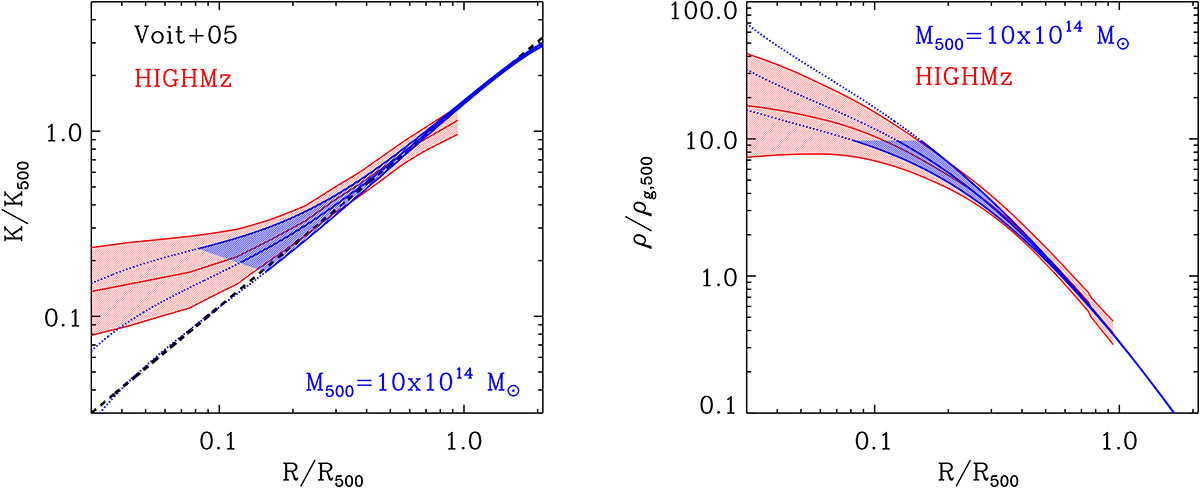
Left panel: Entropy in units of K500 versus radius in units of R500. The three blue lines are derived from the model presented in Sect. 5 with corrections described in Sects. 6.1.1 and 6.1.2. All 3 profiles are computed assuming M500 = 1015 M⊙ and for the gas fraction parameters: lm = 13.2 and ls = −0.75. The ln parameter is set to −1.1, −0.7 and −0.3 respectively for the top, medium and bottom curves. The region between the top and bottom curves is shaded for radii where the cooling time is longer than the time since the gas was shock heated. The red shaded region is the median entropy and intrinsic scatter from the HIGHMz sample presented in Riva et al. (2024). The black dashed line shows the self-similar approximation introduced in Voit et al. (2005). Right panel: Density in units of ρg, 500 versus radius in units of R500. The three blue lines are derived from the model presented in Sect. 5 with corrections described in Sects. 6.1.1 and 6.1.2 using the same parameters for the gas fraction adopted for the entropy profile presented in the left panel. The region between the top and bottom curves is shaded for radii where the cooling time is longer than the time since the gas was shock heated. The red shaded region is the median and intrinsic scatter derived from the HIGHMz sample.
Current usage metrics show cumulative count of Article Views (full-text article views including HTML views, PDF and ePub downloads, according to the available data) and Abstracts Views on Vision4Press platform.
Data correspond to usage on the plateform after 2015. The current usage metrics is available 48-96 hours after online publication and is updated daily on week days.
Initial download of the metrics may take a while.