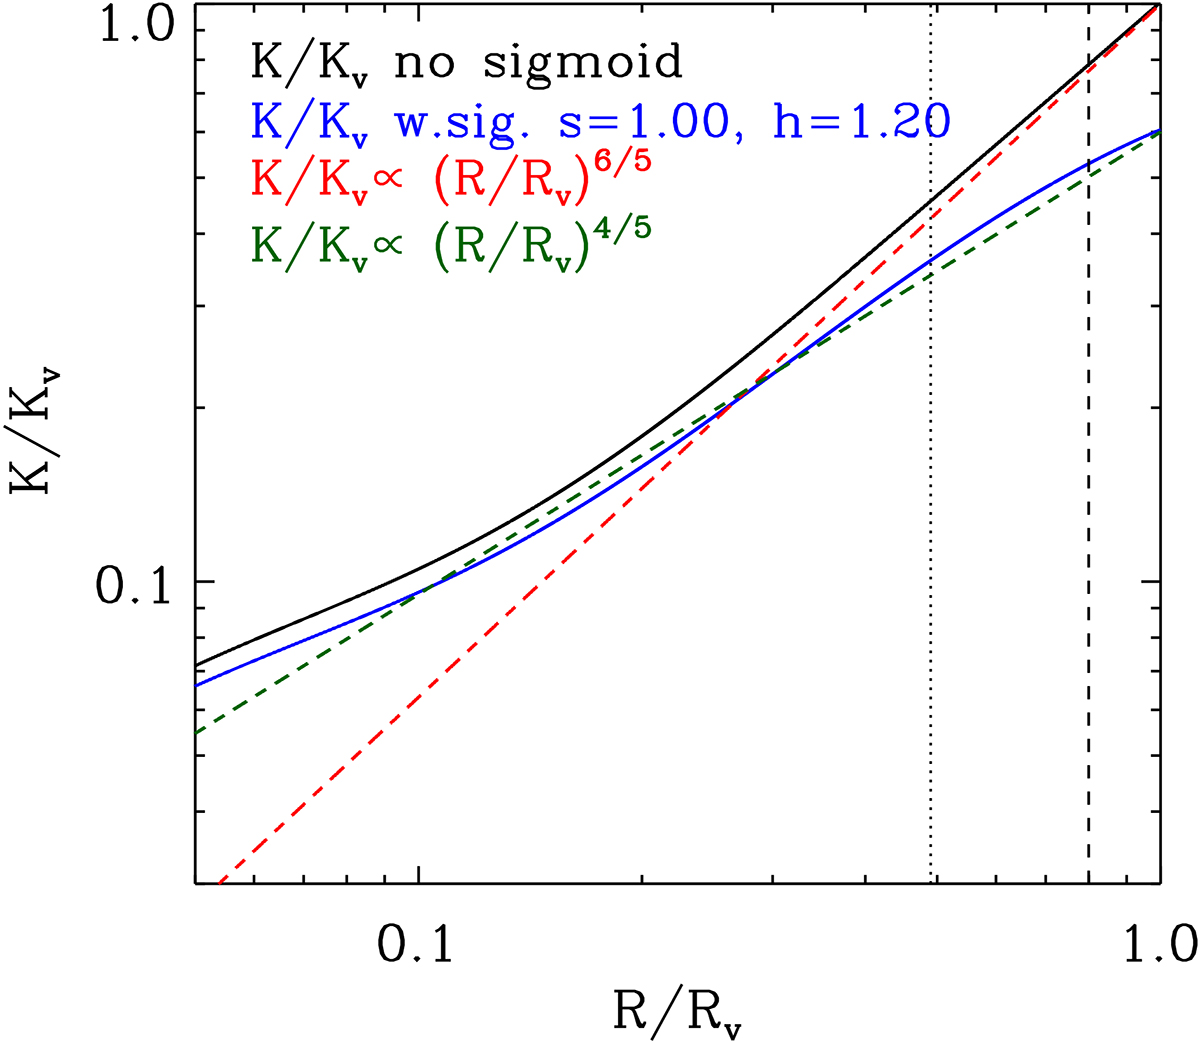
Fig. 16.
Download original image
Radial entropy profiles for a halo of 1015 M⊙ at z = 0. The black filled line shows the profile in the case of single shock at the virial radius. The blue filled line shows a profile modified with a sigmoid of the from reported in Eq. (22) and parameters shown in the figure. The vertical dotted and dashed lines mark the position of R500 and R200 respectively. The slope of the profiles can be gauged by comparison with the power laws plotted as dashed lines.
Current usage metrics show cumulative count of Article Views (full-text article views including HTML views, PDF and ePub downloads, according to the available data) and Abstracts Views on Vision4Press platform.
Data correspond to usage on the plateform after 2015. The current usage metrics is available 48-96 hours after online publication and is updated daily on week days.
Initial download of the metrics may take a while.