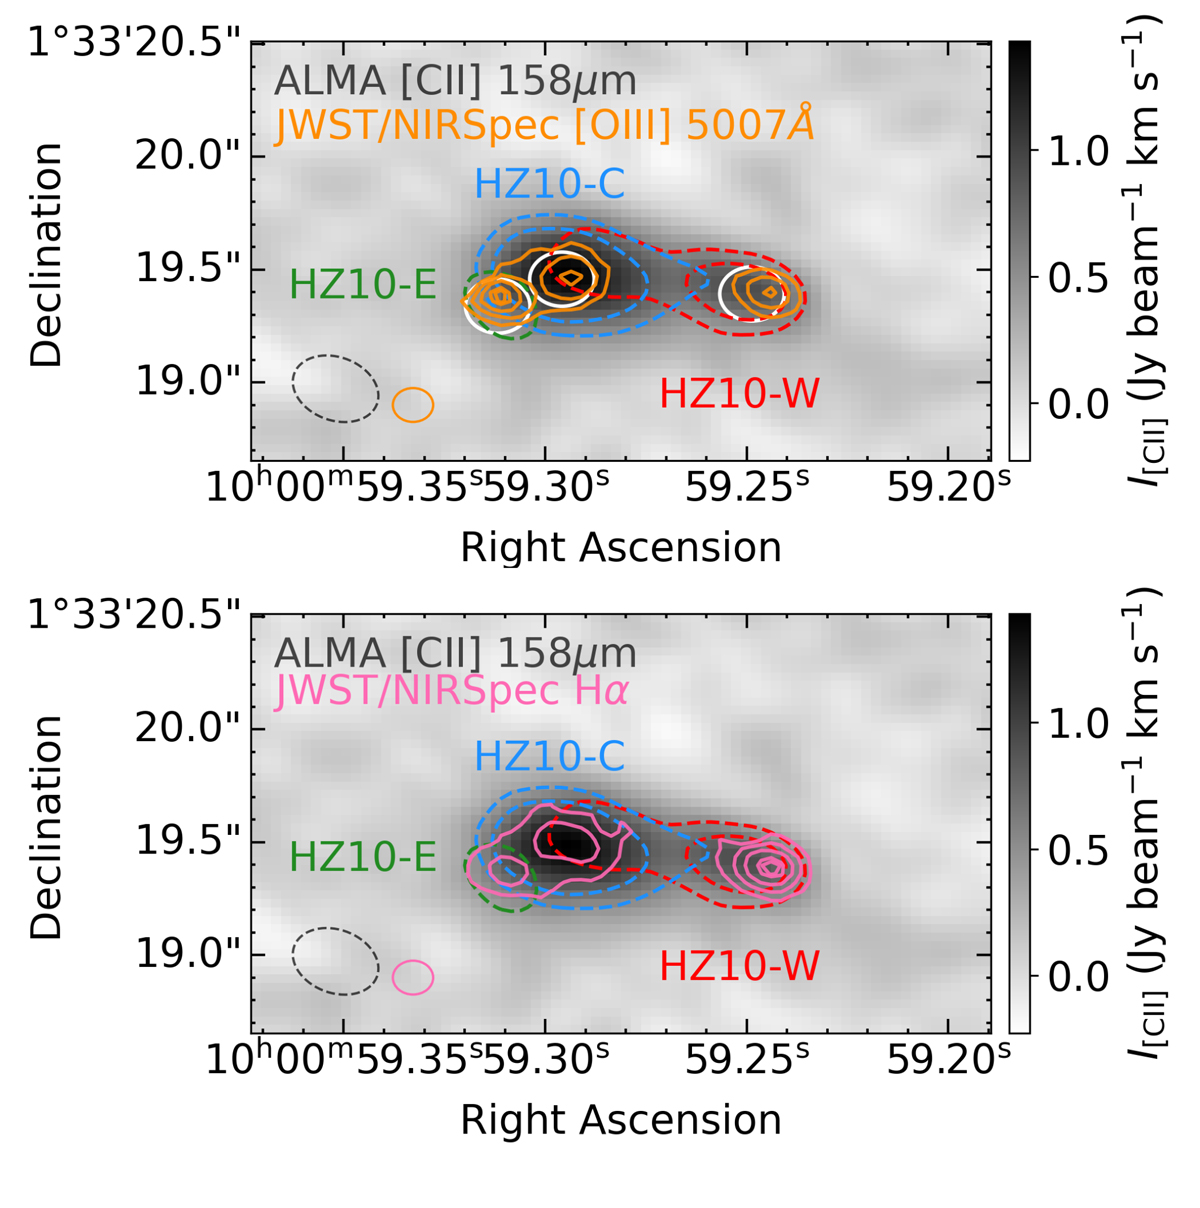
Fig. 9.
Download original image
Integrated [C II] intensity of the whole HZ10 complex in grayscale. To emphasize the spatial positions of the three components seen in [C II], HZ10-E, HZ10-C, and HZ10-W, we overplot contours from Fig. 5. The orange (pink) contours in the top (bottom) panel correspond to the [O III] 5007Å (Hα) relative contours from JWST/NIRSpec observations (Jones et al. 2024). Apertures for the components’ spectra (see Fig. 10) extraction are shown as white circles in the top panel. The beam size of the ALMA observations (0.34″ × 0.27″) and JWST/NIRSpec point spread function (0.15″) are shown in the bottom-left corner of each panel with a dashed gray ellipse and a solid orange (pink) circle, respectively.
Current usage metrics show cumulative count of Article Views (full-text article views including HTML views, PDF and ePub downloads, according to the available data) and Abstracts Views on Vision4Press platform.
Data correspond to usage on the plateform after 2015. The current usage metrics is available 48-96 hours after online publication and is updated daily on week days.
Initial download of the metrics may take a while.